Scenario
Consider your environment has a number of servers. Whenever there is an issue being reported, you have to manually log into each server and check logs to troubleshoot it. Searching for a particular error across hundreds of log files on hundreds of servers becomes a pain if the environment grows bigger. Moreover, there is no way to alert if there is any occurrence of error / abnormal activity in the log files unless the issue is being reported by the application team or after the service becomes unavailable.
Solution:
A common approach to this problem is to setup a centralized logging solution so that multiple logs can be aggregated in a central location. The advantage is not just about centralizing these logs, but getting a better insight of what each system is doing at any point in time. We can parse custom logs using grok pattern or regex and create fields. Segregating the logs using fields helps to slice and dice the log data which helps in doing various analysis. Centralized logging plays a major role as part of operations troubleshooting and analysis.
There are many famous open source / enterprise products for centralized logging such as,
- ELK (Elasticsearch, Logstash, Kibana)
- Splunk
- New Relic
- Graylog
- and more..
One other major player of centralized logging is ELK which is again an open source like graylog. Graylog has some edge over ELK in some aspects when considering out of the box features. To name a few,
- Graylog provides User management out of the box
- Has an inbuilt alert system
- Graylog is able to accept and parse RFC 5424 and RFC 3164 compliant syslog messages out of the box
- Messages forwarded by rsyslog or syslog-ng are usually parsed flawlessly
What we will do?
In this article, we will see end to end setup and implementation of graylog. We will be integrating,
- syslog of all the servers to graylog
- nginx access and error logs to graylog
- apache log to graylog
- mysql slow query log to graylog
- setup GeoLocation to resolve IPs
- setup alert based on conditions
- setup user access control by creating roles
Environment assumption
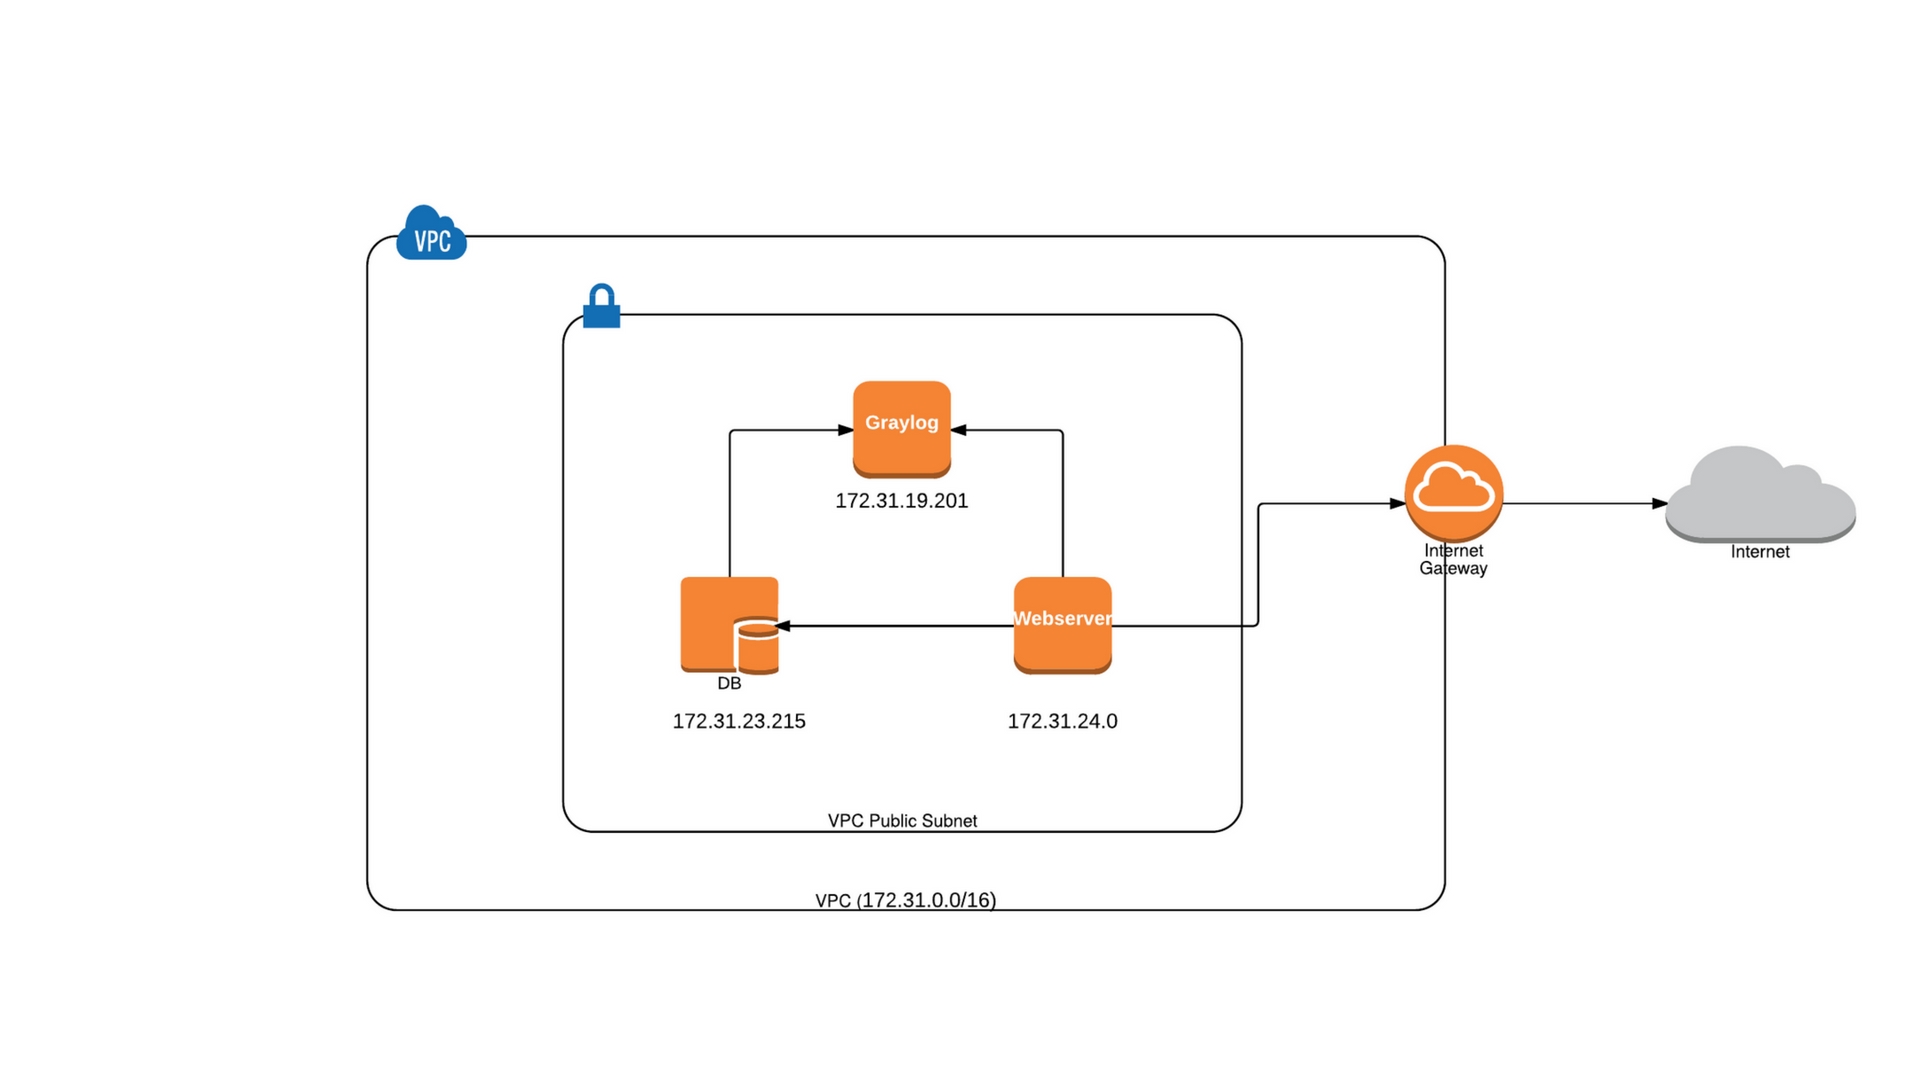
For this example I’ll be using three servers within a VPC in AWS. One will act as Graylog server, one as web server and the other as DB server. The web and DB server can communicate with the Graylog server using Internal IP’s. The architecture looks as below
Graylog – 173.31.19.201
Web – 172.31.24.0
DB – 172.31.23.215
Install Graylog
In this example, the graylog installation will be a single server setup. Before installing graylog, we should be aware of its architecture and its prerequisites. Since graylog is built using Java, we need JRE/JDK to run graylog application. We need the below components to be installed to make graylog working.
- Elasticsearch
- MongoDB
- Graylog
- JDK/JRE
Mongo DB just stores metadata of graylog configuration. In the longer run, this will be removed from graylog architecture. Elasticsearch is used for storage which stores parsed log data as documents in indices. If you are planning for a production setup, then you need consider installing each component in dedicated servers. You should consider creating Elasticsearch, Graylog (multiple graylog nodes ) clusters for high availability and redundancy.
Note: If you use a server with less than 2GB of RAM you will not be able to start all of the Graylog2 components. Therefore you need to use a server with at least 2GB of RAM for graylog to work.
The installation steps are targeted for Ubuntu 16.04.
Install Java 8 and pwgen ( Prerequisites )
$ sudo add-apt-repository ppa:webupd8team/java

$ sudo apt-get update

$ sudo apt-get install apt-transport-https uuid-runtime pwgen oracle-java8-installer
Install Mongo DB
$ sudo apt-key adv --keyserver hkp://keyserver.ubuntu.com:80 --recv EA312927

$ sudo echo "deb http://repo.mongodb.org/apt/ubuntu "$(lsb_release -sc)"/mongodb-org/3.2 multiverse" | sudo tee /etc/apt/sources.list.d/mongodb-org-3.2.list

$ sudo apt-get update

$ sudo apt-get install -y mongodb-org

$ sudo systemctl start mongod

$ sudo systemctl enable mongod
Install Elasticsearch
$  cd /tmp

$  wget -qO - https://packages.elastic.co/GPG-KEY-elasticsearch | sudo apt-key add -

$ sudo echo "deb https://packages.elastic.co/elasticsearch/2.x/debian stable main" | sudo tee -a /etc/apt/sources.list.d/elasticsearch-2.x.list

$ sudo apt-get update && sudo apt-get install elasticsearch
Make sure to modify the Elasticsearch configuration file /etc/elasticsearch/elasticsearch.ymland set the cluster name to graylog additionally you need to uncomment (remove the # as first character) the line:
cluster.name: graylog
After you have modified the configuration, you can start Elasticsearch:
$ sudo systemctl daemon-reload

$ sudo systemctl enable elasticsearch.service

$ sudo systemctl restart elasticsearch.service
Install Graylog
$ cd /tmp

$ wget https://packages.graylog2.org/repo/packages/graylog-2.2-repository_latest.deb

$ sudo dpkg -i graylog-2.2-repository_latest.deb

$ sudo apt-get update && sudo apt-get install graylog-server
Once graylog is installed, we need to set ‘password_secret‘ and ‘root_password_sha2‘ in graylog’s server.conf file. These settings are mandatory and without them, Graylog will not start!
We can generate a random key for the secret key ( password_secret ) using pwgen.
SECRET=$(pwgen -s 96 1)

sudo -E sed -i -e 's/password_secret =.*/password_secret = '$SECRET'/' /etc/graylog/server/server.conf
We have set a random password in the variable SECRET. We then used sed command to replace password_secret variable in ‘/etc/graylog/server/server.conf’ file
Lets do the same for ‘root_password_sha2’ which will be our admin password. But this time lets use a password which we can remember instead of using pwgen, since we will use this to login to graylog dashboard.
PASSWORD=$(echo -n '<your password here>' | shasum -a 256 | awk '{print $1}')

sudo -E sed -i -e 's/root_password_sha2 =.*/root_password_sha2 = '$PASSWORD'/' /etc/graylog/server/server.conf
We are done with initial setup of graylog. Lets start and enable the graylog service
$ sudo systemctl daemon-reload

$ sudo systemctl enable graylog-server.service

$ sudo systemctl start graylog-server.service
By default, graylog runs on port 9000. You can access graylog server directly over internet using its public IP address and port 9000. But for this to work, you need to set ‘rest_listen_uri‘ and ‘web_listen_uri’ to the public hostname or a public IP address of the server.
But the recommended way is to use nginx or apache as reverse proxy in front of graylog server. Further, this will allow us to secure our connection using HTTPS protocol which the direct connection (port 9000) does not provide.
Configure Nginx as reverse proxy for Graylog
I’ve already covered an article on how to setup nginx as caching reverse proxy for apache. Please read through it if you want to know more about how it works. For this, we will ignore caching and only configure nginx to proxy request to graylog.
Install nginx by running the below commands.
$ sudo echo "deb http://nginx.org/packages/ubuntu/ $release nginx" >> /etc/apt/sources.list.d/nginx.list

$ sudo echo "deb-src http://nginx.org/packages/ubuntu/ $release nginx" >> /etc/apt/sources.list.d/nginx.list

$ sudo apt-get update

$ sudo apt-get install nginx
Replace $release with the name of your distribution, such as xenial or trusty.
If a W: GPG error: http://nginx.org/packages/ubuntu xenial Release: The following signatures couldn’t be verified because the public key is not available: NO_PUBKEY $key is encountered during the NGINX repository update, execute the following:
$ sudo apt-key adv --keyserver keyserver.ubuntu.com --recv-keys $key
$ sudo apt-get update
$ sudo apt-get install nginx
Replace $key with the corresponding $key from your GPG error.
After installing nginx, we need to modify the site configuration to proxy request to graylog server.
$ cd /etc/nginx/conf.d/

$ sudo mv default.conf default.conf_bkp

$ sudo touch graylog_site.conf
copy the below content inside ‘graylog_site.conf’ file
server
{
  listen      80 default_server;
  listen      [::]:80 default_server ipv6only=on;
  server_name <Server IP or Domain Name>;

  location /
    {
        proxy_set_header    Host $http_host;
        proxy_set_header    X-Forwarded-Host $host;
        proxy_set_header    X-Forwarded-Server $host;
        proxy_set_header    X-Forwarded-For $proxy_add_x_forwarded_for;
        proxy_set_header    X-Graylog-Server-URL http://<Server IP or Domain Name>/api;
        proxy_pass          http://127.0.0.1:9000;
    }
}
You can customize the above configuration to use SSL for HTTPS connection. But for this example, I’ll be sticking with this simple HTTP configuration.
Start nginx service by running the below command
sudo systemctl start nginx
Let’s try accessing graylog server now. You can use the public IP of the server or the Domain name which you have configured as part of ‘server_name’ variable in the ‘graylog_site.conf’ file. You’ll get a login page as below.
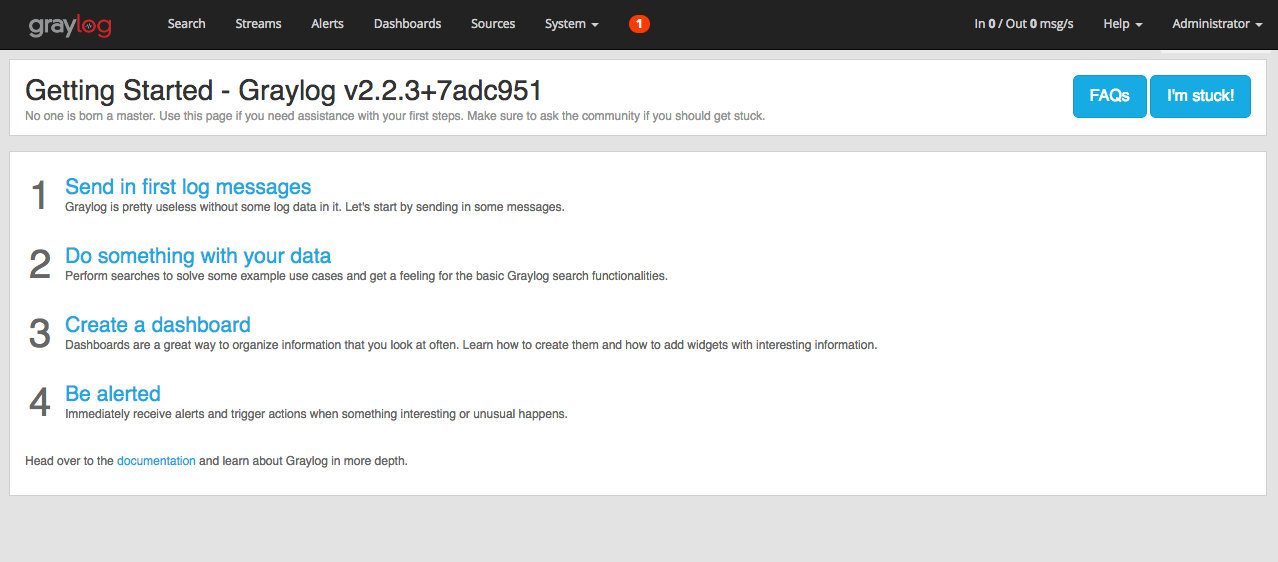
You can login with the username – admin and the password which you have set earlier for ‘root_password_sha2‘. You’ll get the Getting started page.
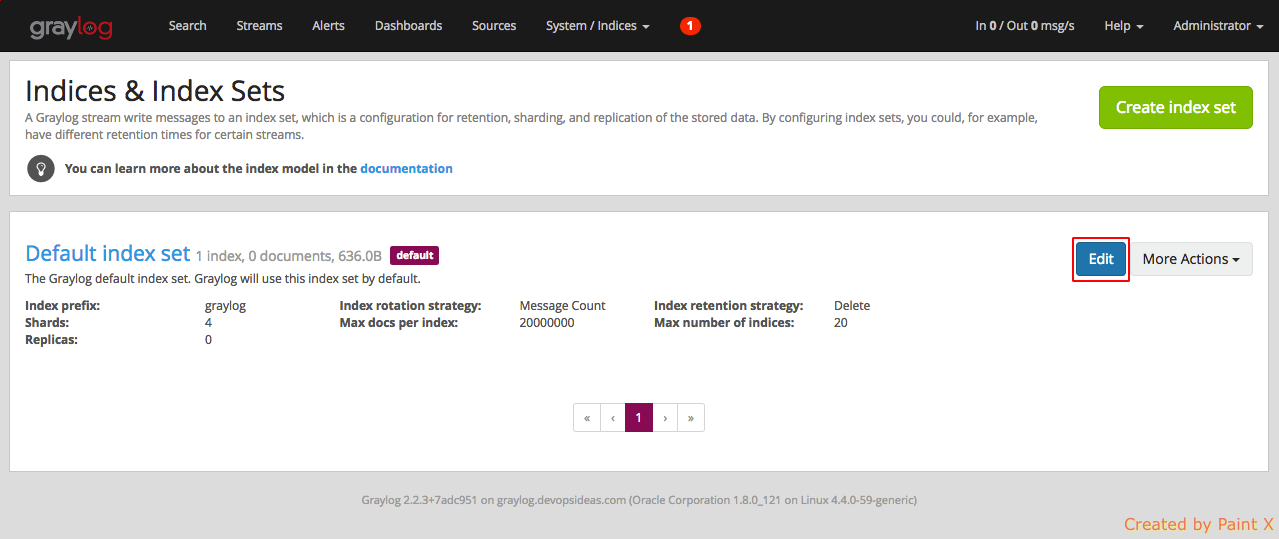
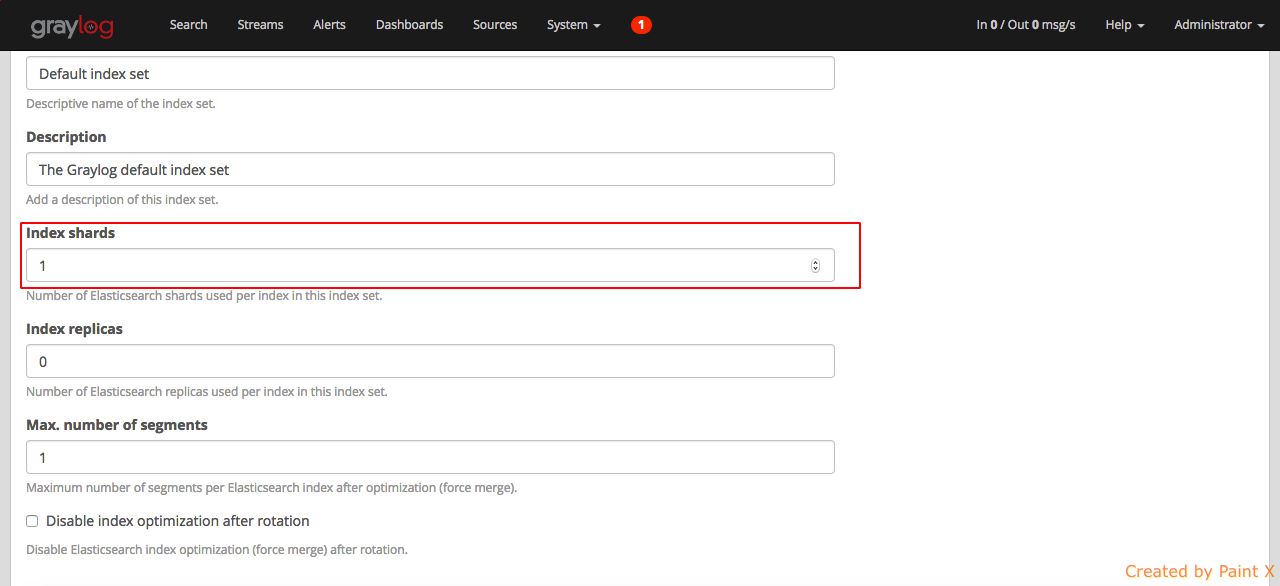
As a first configuration change in the graylog dashboard, lets change the number of elasticsearch shard to 1. By default the value is set to 4. Since we only have one elasticsearch node running, we can change this to 1. In the case of running multiple elasticsearch nodes, pay careful attention while allocating shards. To know more about elasticsearch jargons like index, shard, cluster, node and replica you can visit this site
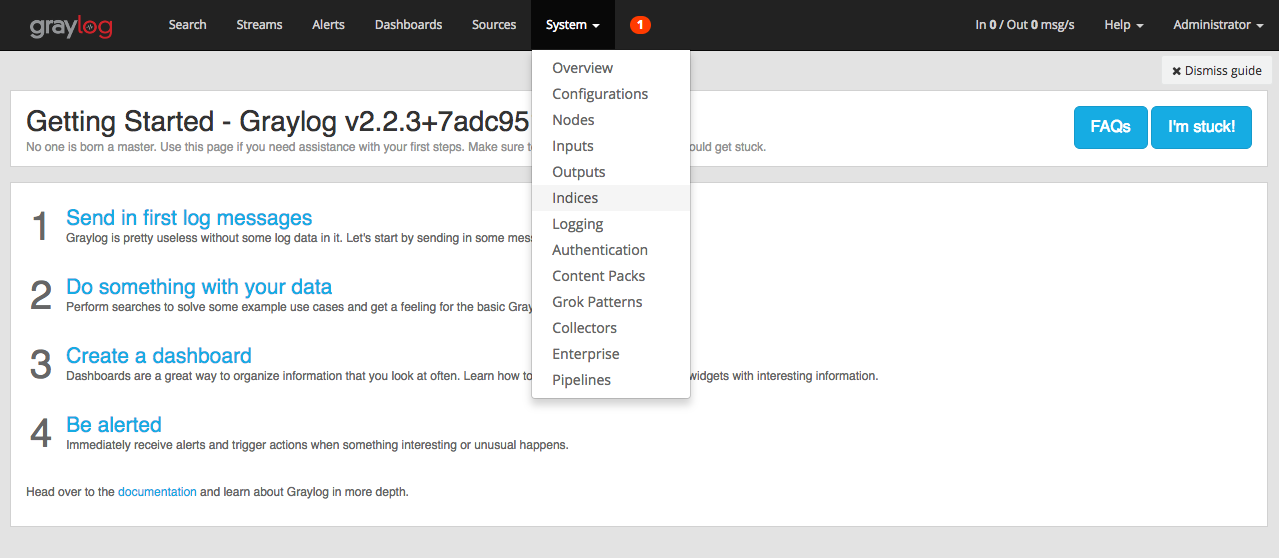
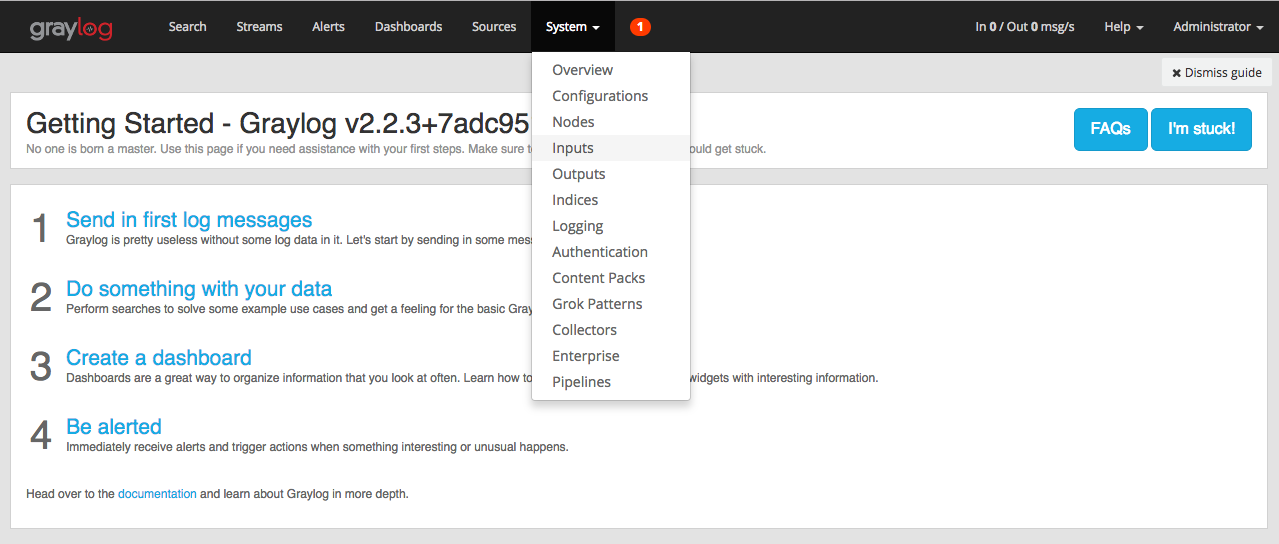
To change number of shards, select System –> Indices
Click the Edit button for default index
Change the value of ‘Index shards’ to 1 and hit save
Create Input for receiving syslog
We need to create inputs in graylog in order to send log data from client to graylog server. After creating an input, a corresponding service will start listening in a port through which the clients can send logs to.
To create an input, select ‘System–>Inputs’
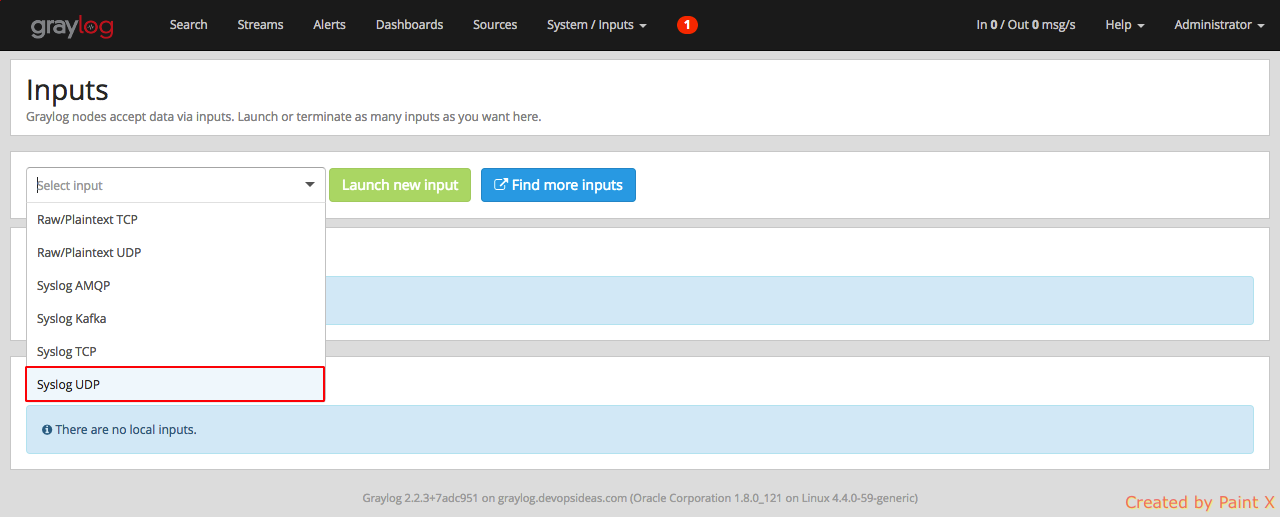
Click the drop down box in the input section and select ‘Syslog UDP’.
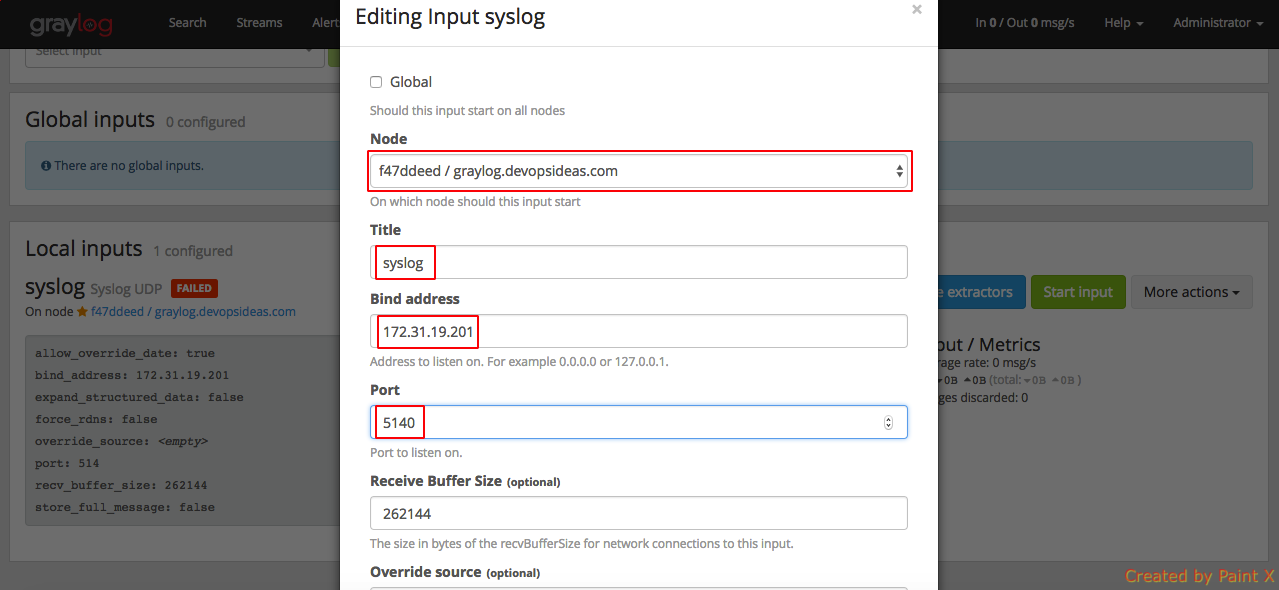
Enter the information as below
Node: <Select from dropdown>
Title: syslog
Port: 5140
Bind address: <graylog_private_IP>
Note: If you have multiple graylog nodes, then you can check the ‘Global‘ checkbox. In our case I’ll leave it unchecked since we have only one node.
Click save after filling the required information. If everything goes well, you should see the syslog input running as part of Local inputs.
Configure Rsyslog to Send Syslogs to Graylog Server from Web and DB
Now that we have an input created for receiving syslogs, we can configure our Web and DB server to send syslogs to Graylog Server using syslog input in port 5140. Graylog is able to accept and parse RFC 5424 and RFC 3164 compliant syslog messages out of the box. Hence we don’t need to create any regex or grok pattern for parsing.
On all of your client servers, the servers that you want to send syslog messages to Graylog, do the following steps. In our example, I’ll be doing this in Web ( 172.31.24.0 ) and DB ( 172.31.23.215 ) server.
Create an rsyslog configuration file in /etc/rsyslog.d. We will call ours 90-graylog.conf
# In Web and DB server
$ sudo vi /etc/rsyslog.d/90-graylog.conf
Add the following lines to configure rsyslog to send syslog messages to Graylog server
*.* @172.31.19.201:5140;RSYSLOG_SyslogProtocol23Format
172.31.19.201 is the private IP of the graylog server
Restart rsyslog for the change to take effect
systemctl restart rsyslog
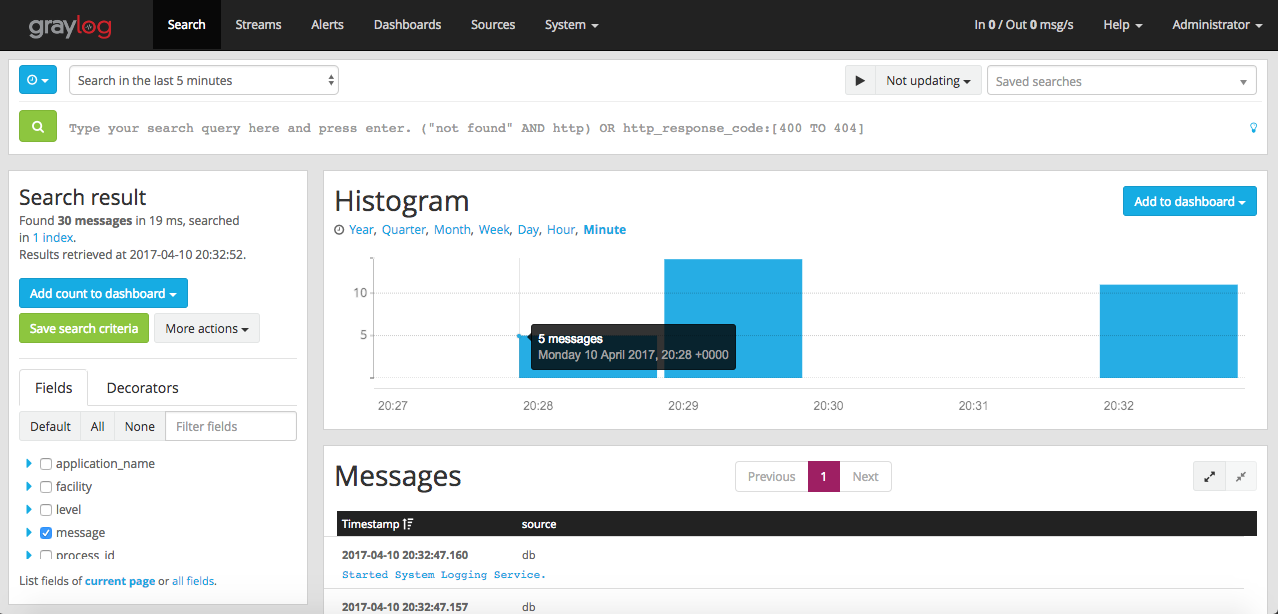
Login to Graylog dashboard and select ‘Search’. You should see the counts of log getting processed in the histogram.
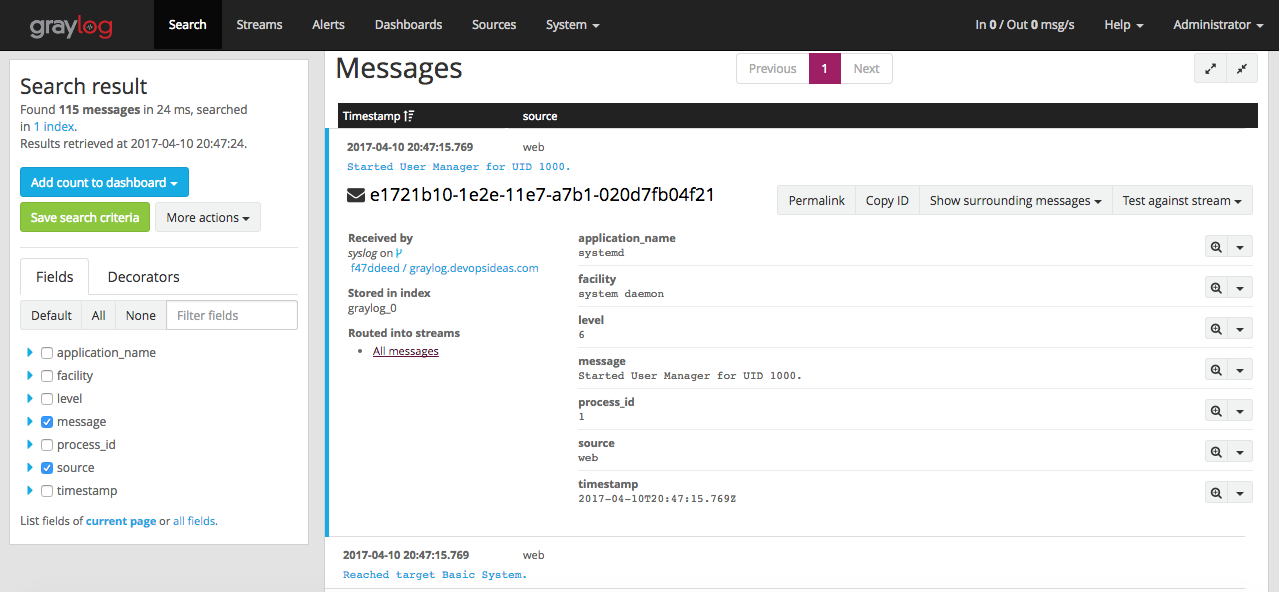
You can see how Graylog has parsed the logs with different fields by clicking on the individual messages
Configure Web host to send nginx logs to Graylog server
Consider we have setup nginx reverse proxy in our web server. Assume that the nginx acts as a proxy to apache. I’ll not explain how to implement nginx reverse proxy since this article is about centralized logging. You can refer this to know how to implement nginx as caching reverse proxy for apache.
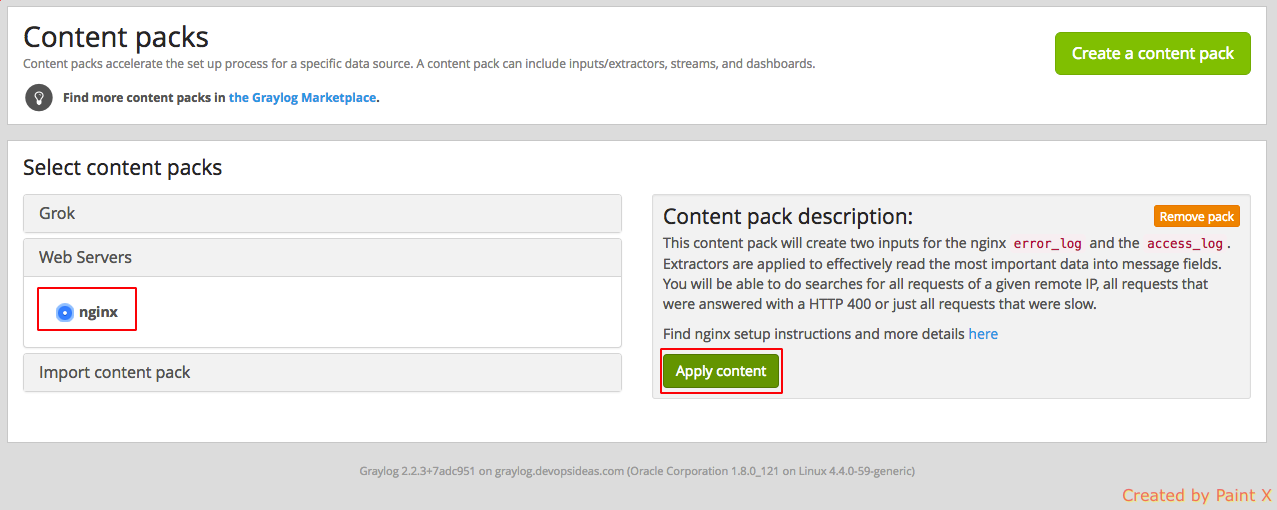
We will be using a content pack for sending nginx logs to graylog.
Content packs are bundles of Graylog input, extractor, stream, dashboard, and output configurations that can provide full support for a data source. Some content packs are shipped with Graylog by default and some are available from the website. Content packs that were downloaded from the Graylog Marketplace can be imported using the Graylog web interface.
We have already seen what a Graylog input is. We will see what extractor, streams and dashboards are in the apache and slow query logs integration section. The Graylog Marketplace is the central directory of add-ons for Graylog. It contains plugins, content packs, GELF libraries and more content built by Graylog developers and community members.
GELF stand for Graylog Extended Log Format. It address the shortcomings of plain syslog. GELF is a great choice for logging from within applications. There are libaries and appenders for many programming languages and logging frameworks so it is easy to implement. You could use GELF to send every exception as a log message to your Graylog cluster. You don’t have to care about timeouts, connection problems or anything that might break your application from within your logging class because GELF can be sent via UDP
Go to Graylog Marketplace and search for nginx in the search box. We will be using the content pack created by ‘lennartkoopmann’.
Select the pack and click ‘View on Github’ and download the zip file
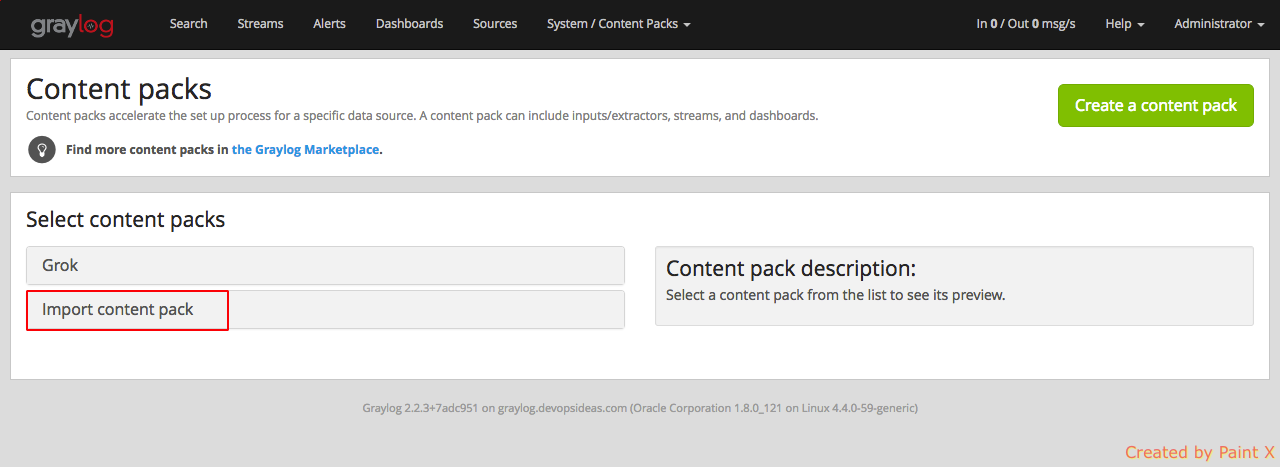
Unpack the downloaded zip file. Go to graylog portal and select System –> Content Packs and then click ‘Import content pack‘.
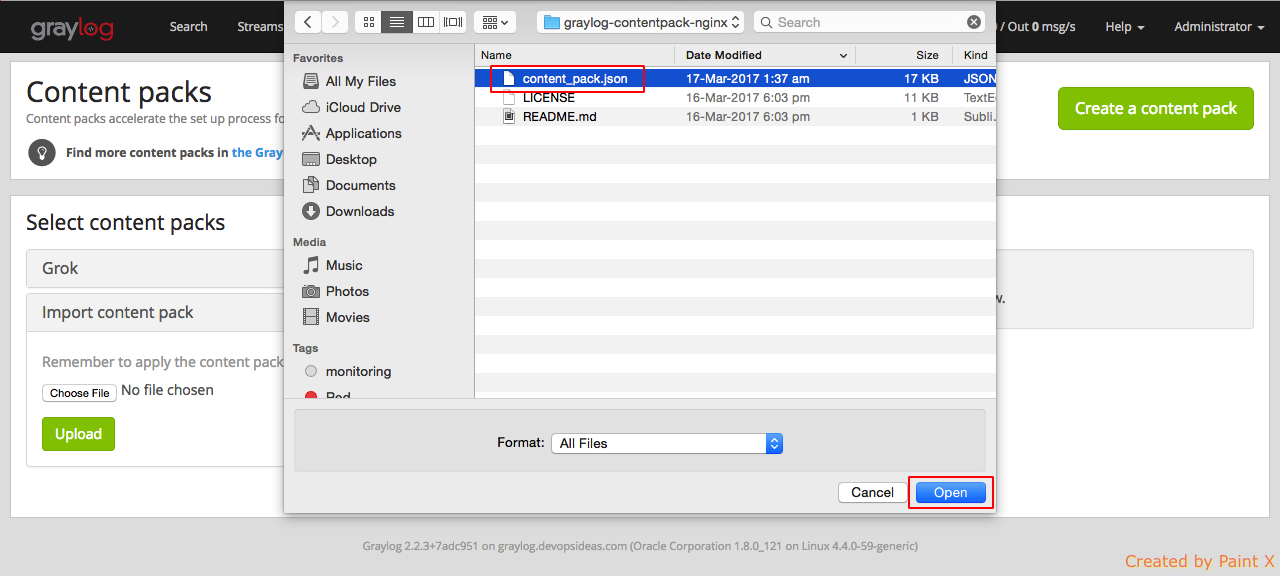
Select ‘Choose File’ and navigate and select ‘content_pack.json’ file which we unpacked earlier and click Open.
You’ll get a success message once the file gets uploaded. Next, we need to apply the content which we uploaded.
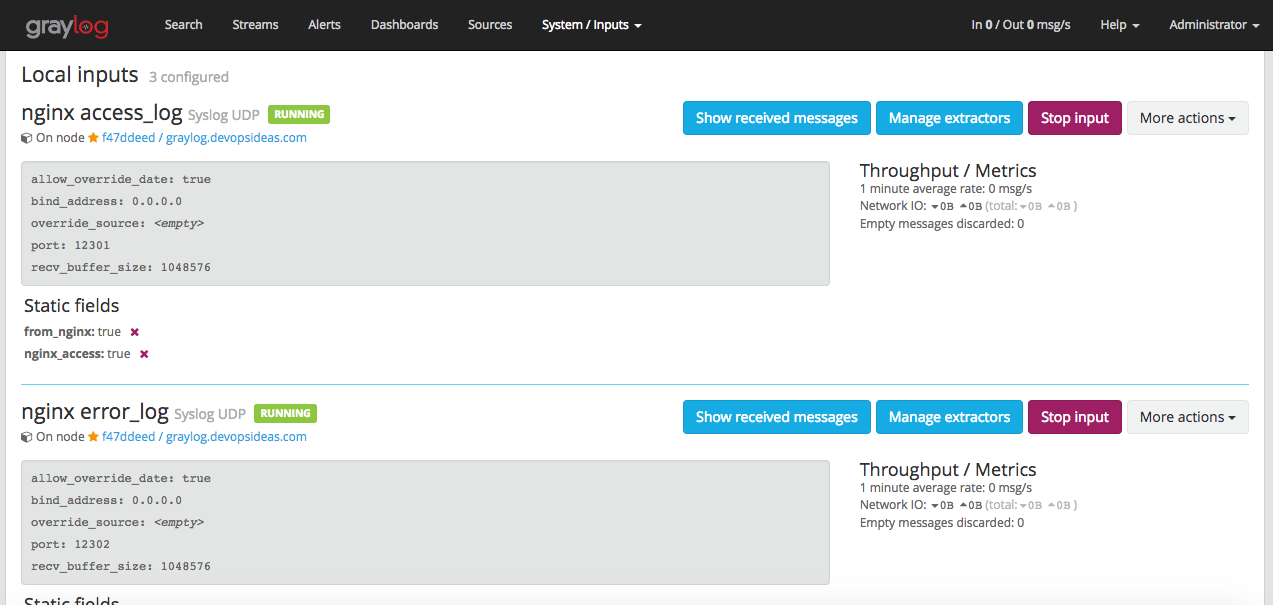
Now, lets check what the content pack has created. Navigate to ‘System–>Inputs‘. You’ll see two inputs created for nginx access and error log listening on port 12301 and 12302 respectively.
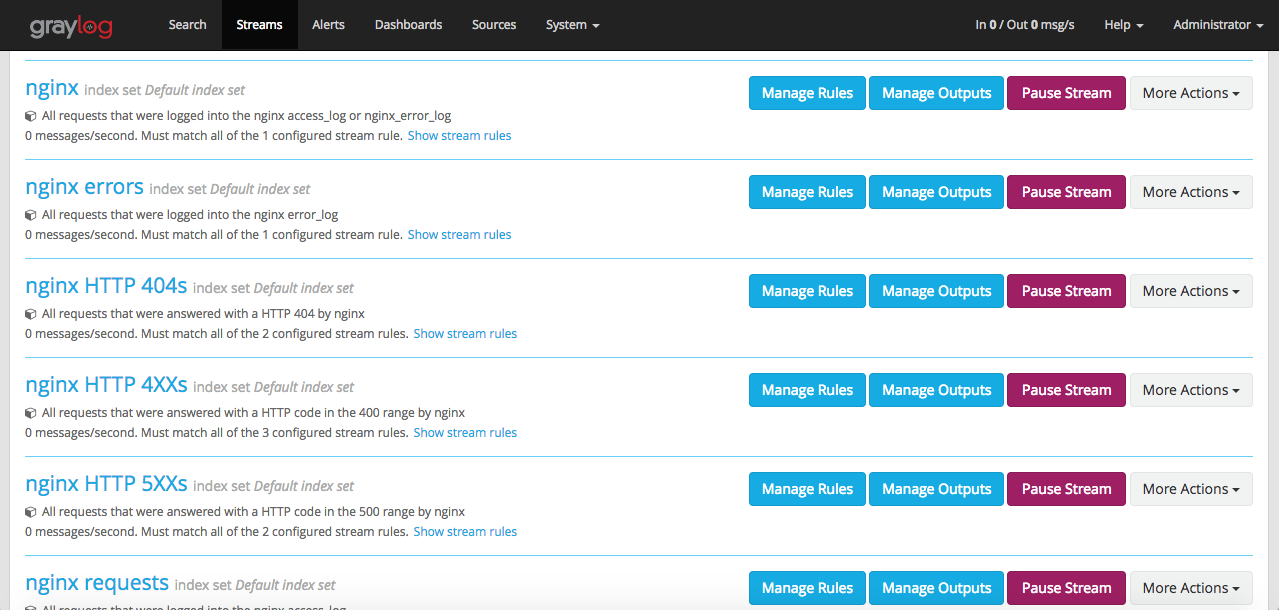
Navigate to ‘Streams‘. You’ll see a list of streams getting created. We will see the use of streams when we configure User roles and Alerts.
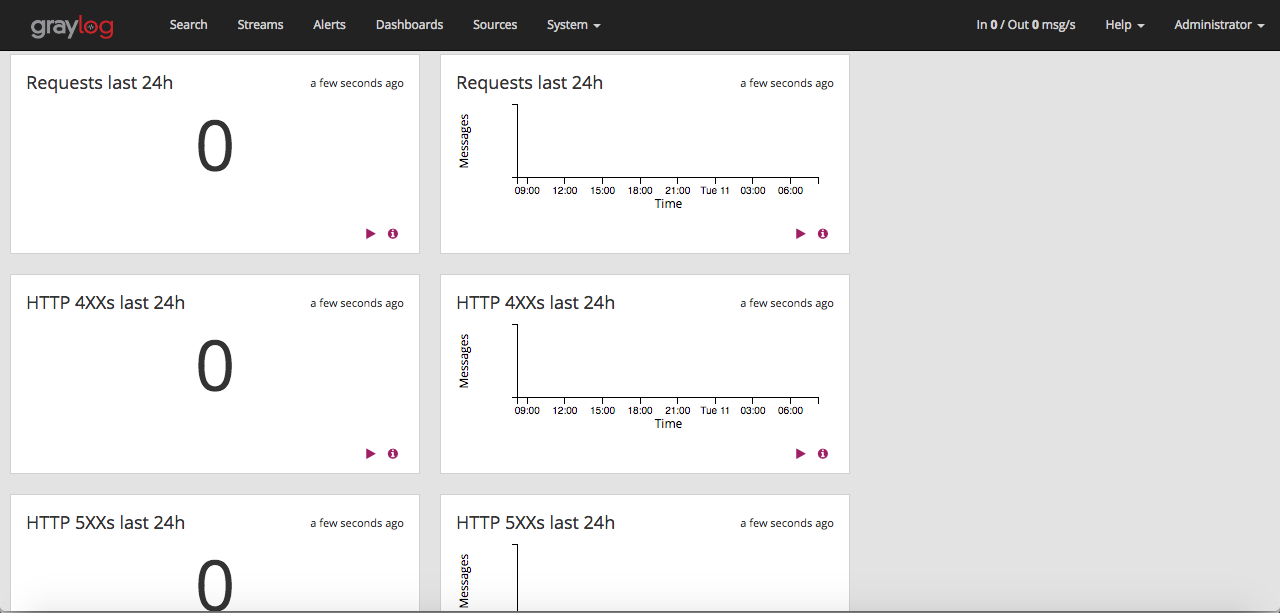
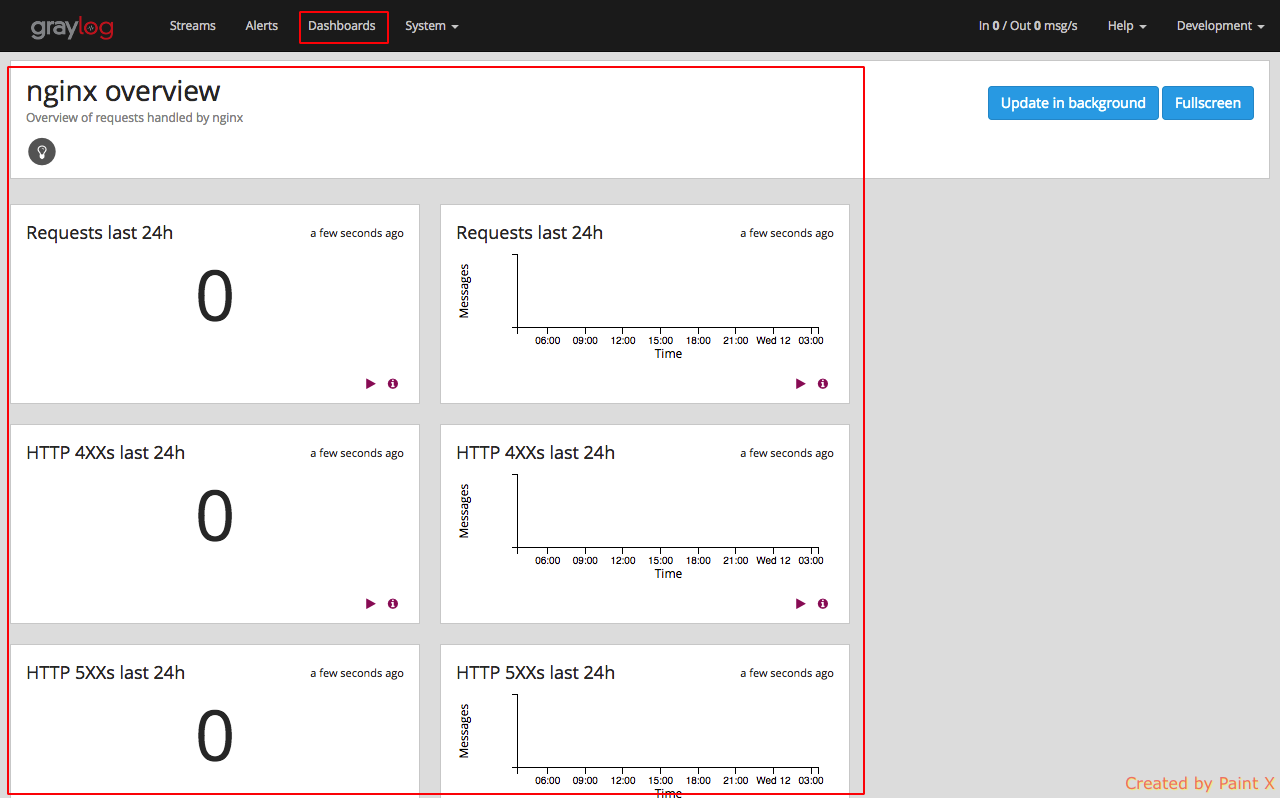
Navigate to ‘Dashboards‘. You can see predefined nginx metrics created as part of the content pack that we imported.
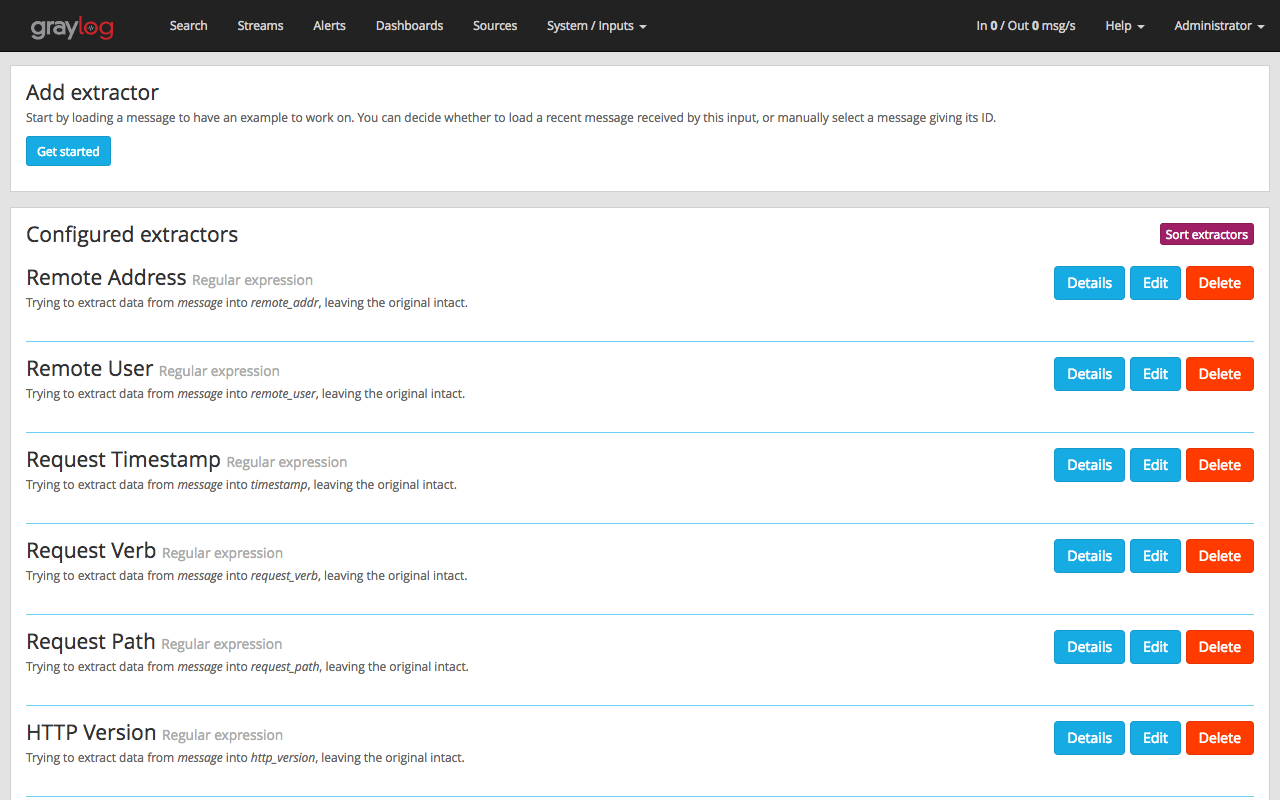
Navigate to ‘System–>Inputs‘ and click ‘Manage extractors’ for nginx access_log input.
You’ll see a list of extractors being created. These extractors can be a regex or grok pattern. In this case, the content pack uses regex to create fields using extractors. We will see how this gives our logs a deeper insights and makes querying much easier with the help of fields.
Now, lets configure nginx to send the access and error log to graylog. In the Web server, open ‘/etc/nginx/nginx.conf’ file and add the below content within the http section.
log_format  graylog2_format  '$remote_addr - $remote_user [$time_local] "$request" $status $body_bytes_sent "$http_referer" "$http_user_agent" "$http_x_forwarded_for" <msec=$msec|connection=$connection|connection_requests=$connection_requests|cache_status=$upstream_cache_status|cache_control=$upstream_http_cache_control|expires=$upstream_http_expires|millis=$request_time>';

access_log syslog:server=172.31.19.201:12301 graylog2_format;
error_log syslog:server=172.31.19.201:12302;
Here 172.31.19.201 is the private IP of the graylog server. The log_format defines the logging to be in the GELF format. We then pass it to syslog which then sends it to our graylog server.
Reload nginx for the changes to take effect
$ systemctl reload nginx
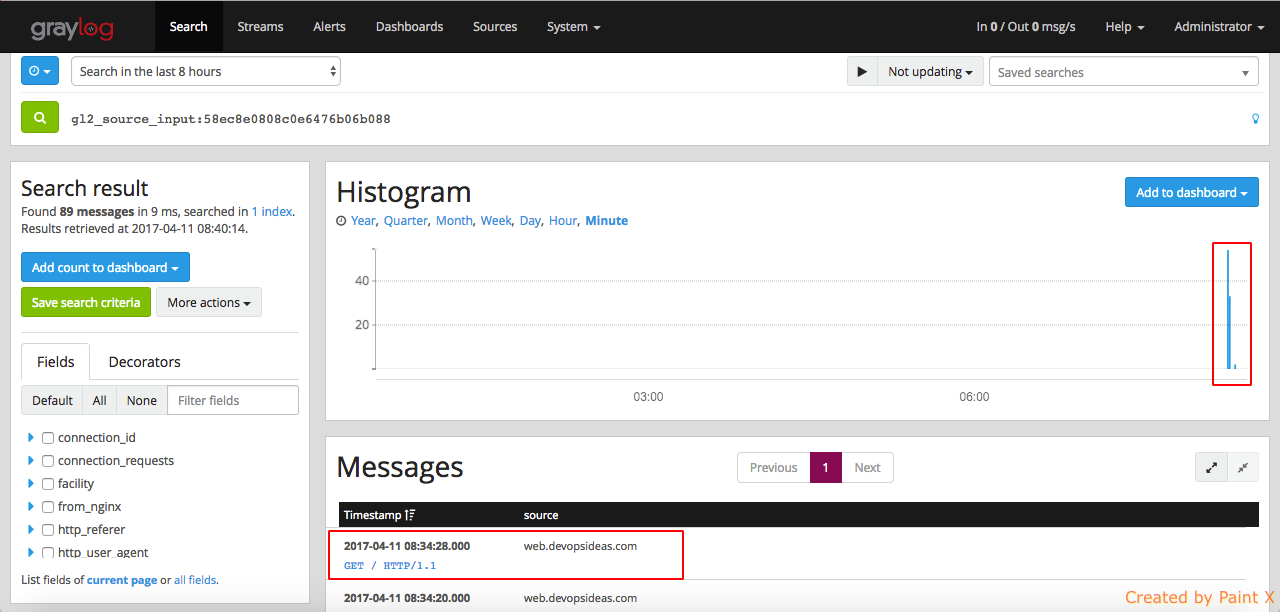
Let’s verify if the nginx logs are getting shipped into graylog by navigating to ‘System–>Inputs–>Show received messages (nginx access_log)’. If everything goes well, you will see messages from our nginx server from our Web host as below,
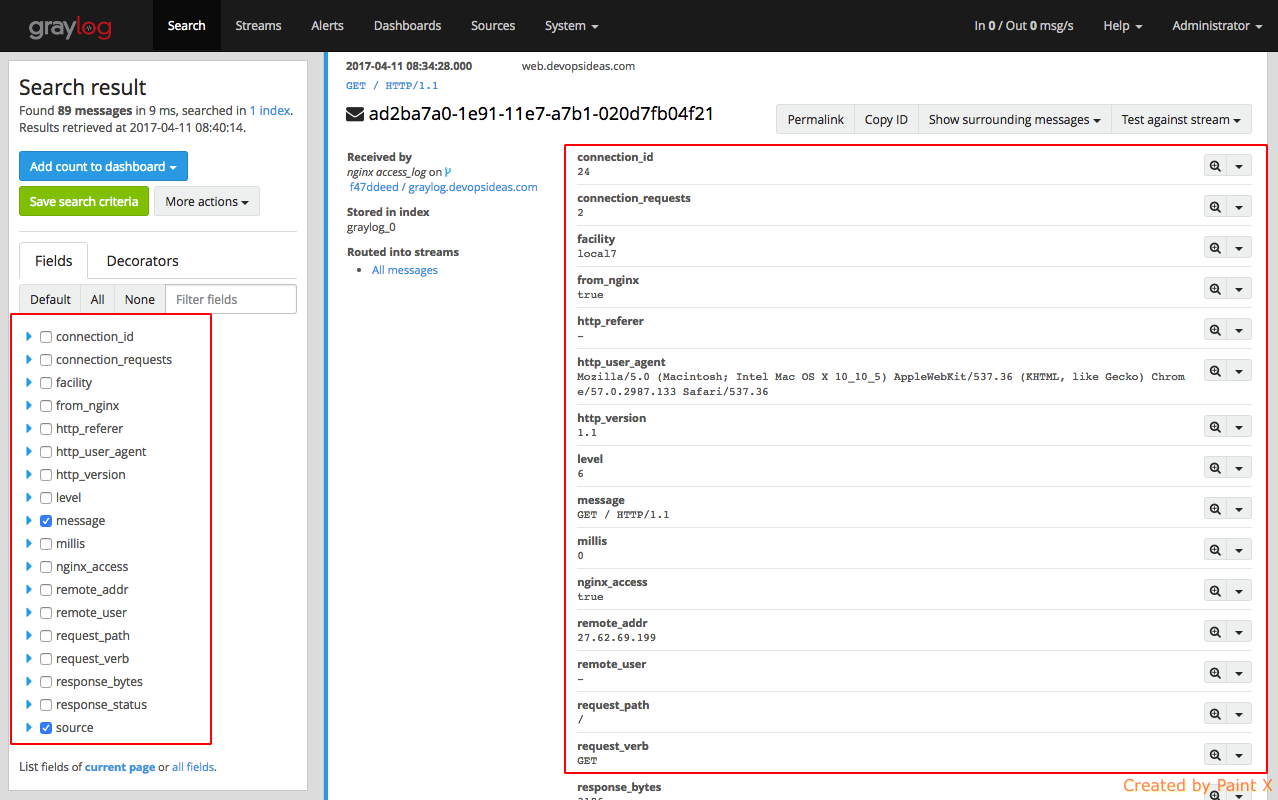
By clicking on individual message, you’ll see the log file content split into different fields. This is work of the extractor which we discussed earlier. This helps us to query the log files and filter it as per our need.
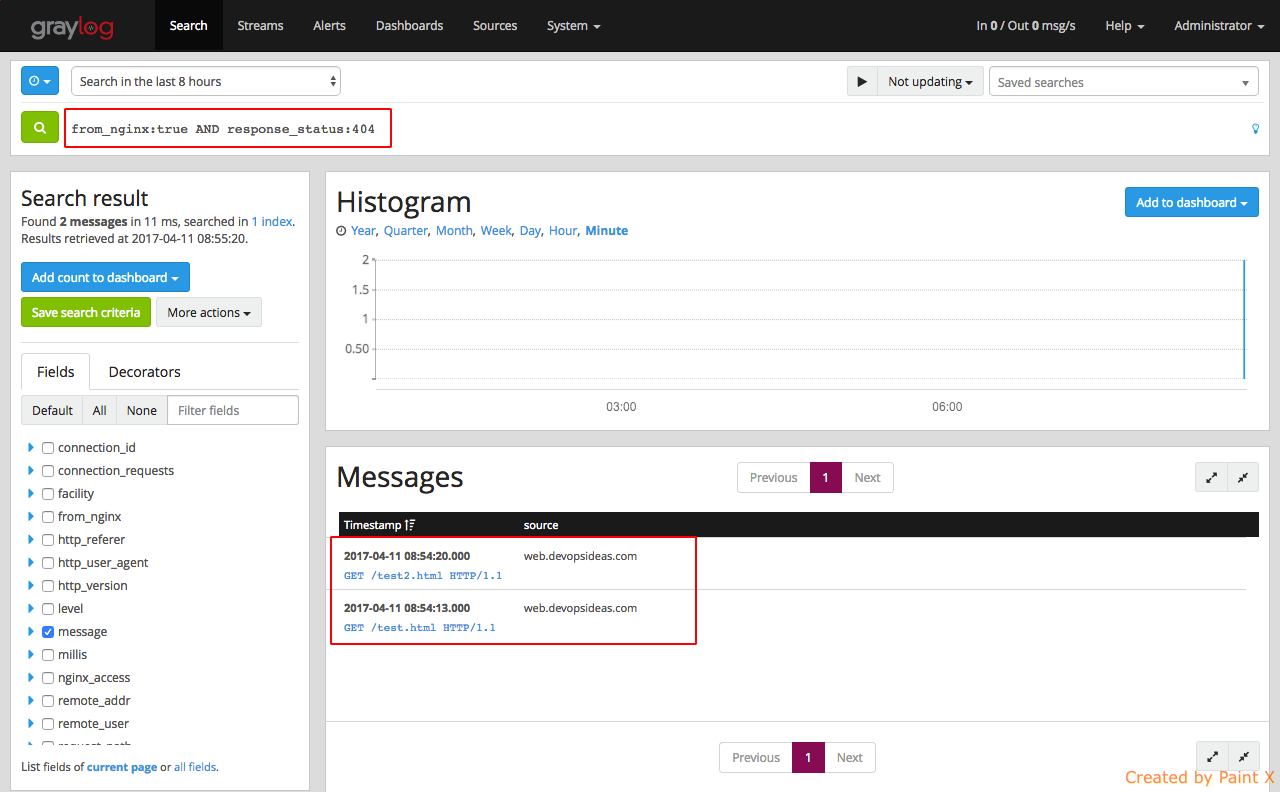
For example, lets search for requests that has 404 as response code from nginx log file. We can run a query as below.
Configure Web host to send apache logs to Graylog server
Unlike nginx contenct pack, we will use Apache GELF module from Graylog Marketplace to ship apache logs to graylog. We will be using this module from graylog marketplace. This requires apache to run in mpm_prefork.
Caution: This module is still in beta stage and not tested in production as of writing this module. If you are not confident using this in your production environment, you can use graylog collector sidecar to send apache logs. We will use this method for shipping DB slow query logs to graylog.
Follow the below steps for installing and configuring Apache GELF module in our Web host.
$ sudo a2enmod mpm_prefork
$ sudo apt-get install libjson-c2 zlib1g
$ cd /tmp
$ wget https://github.com/graylog-labs/apache-mod_log_gelf/releases/download/0.2.0/libapache2-mod-gelf_0.2.0-1_amd64.ubuntu.deb
$ sudo dpkg -i libapache2-mod-gelf_0.2.0-1_amd64.ubuntu.deb
$ sudo a2enmod log_gelf
$ sudo systemctl restart apache2
Now that apache gelf module is installed in our web host, let us create a GELF UDP input in our graylog server for sending our apache logs.
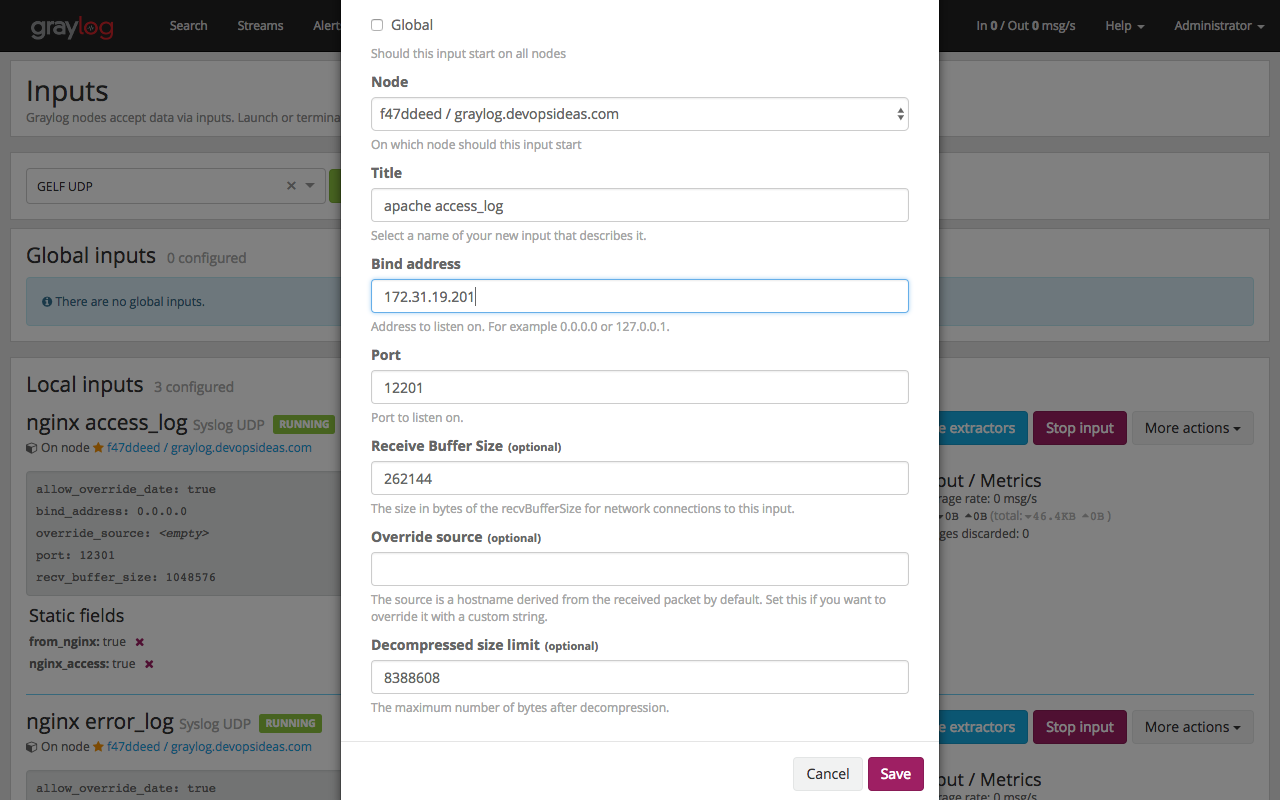
Go to ‘System–>Inputs‘. From the drop down, select ‘GELF UDP‘ and click Launch Input.
Enter the below options. Replace Bind address with the private IP of your graylog server
You should now see, GELF UDP input for apache running in port 12201
We have created a Graylog Input for sending our apache logs. Lets configure our apache server in our web host to send the logs.
$ sudo vi /etc/apache2/mods-enabled/log_gelf.conf
Copy the below content to the file
GelfEnabled On
GelfUrl "udp://172.31.19.201:12201"
GelfSource "web.devopsideas.com"
GelfFacility "apache-gelf"
GelfTag "apache_access"
GelfCookie "tracking"
GelfFields "ABDhImsvRti"
Replace, 172.31.19.201 with your graylog private IP and GelfSource to the hostname of your web host. Check out the meaning of each flag of GelfFields in the readme
Reload apache
systemctl reload apache2
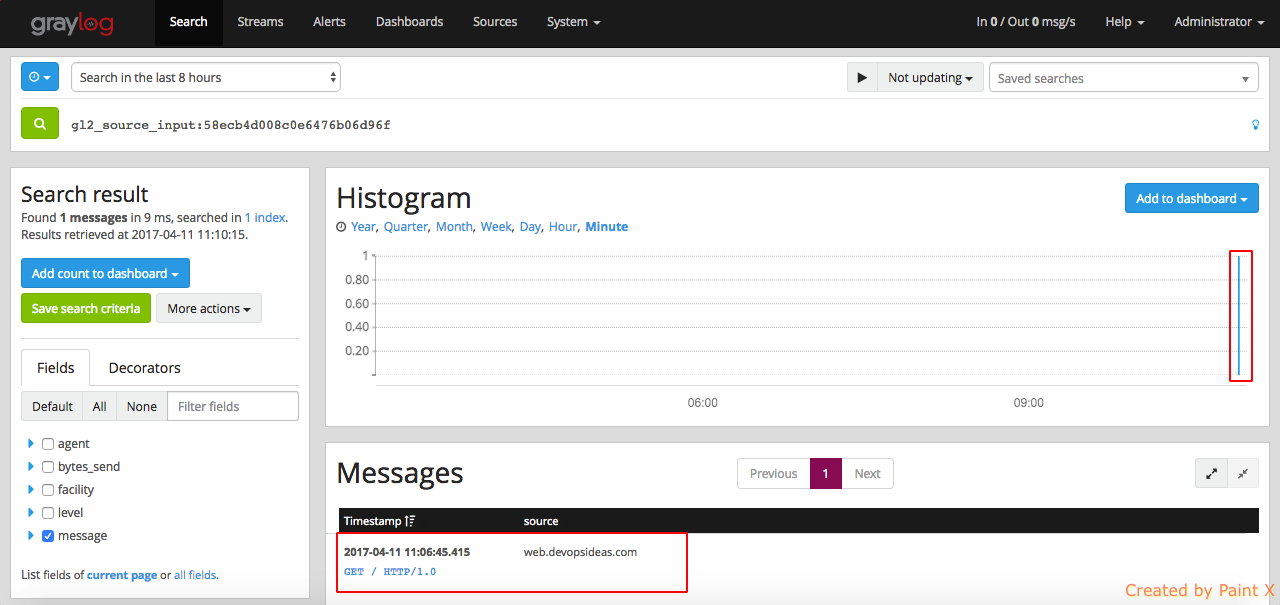
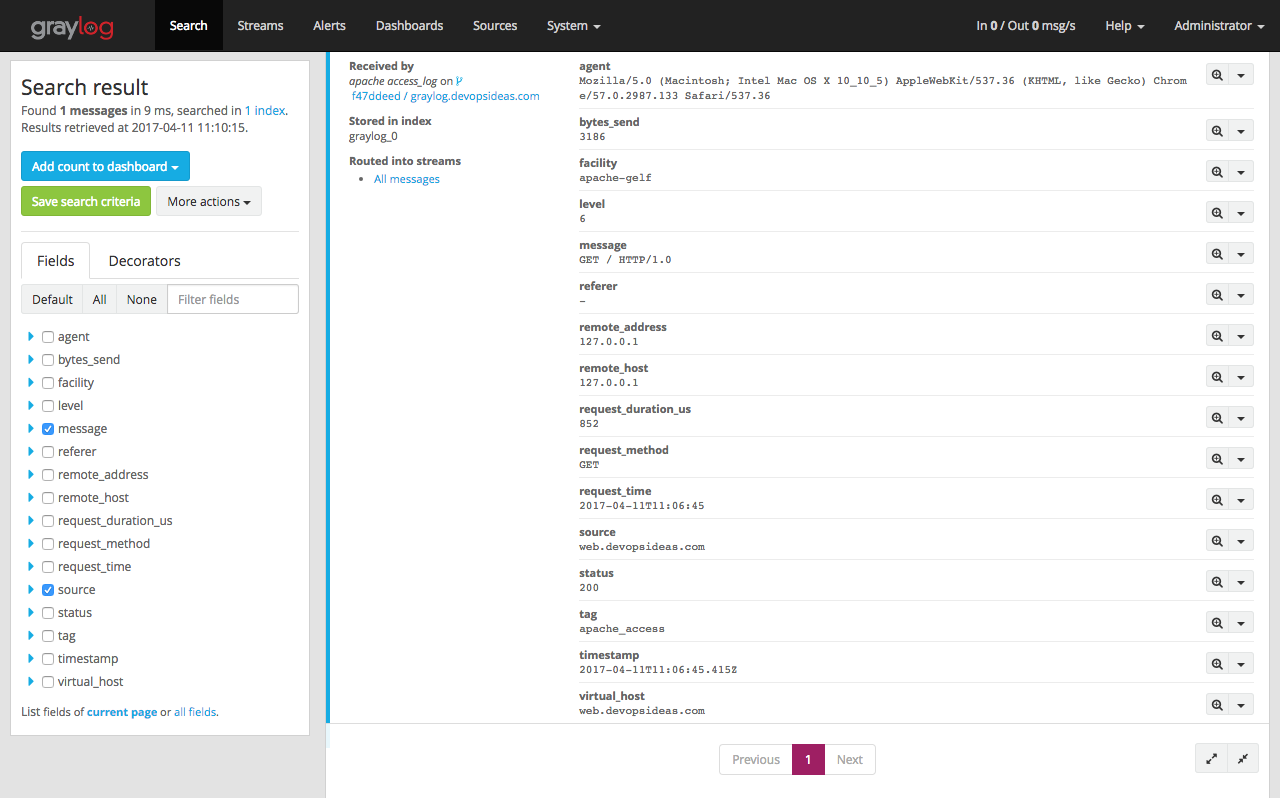
Access your application to get some logs in apache server. Go to “System–>Inputs” click ‘Show received messages” for apache access_log input. You should see logs being received by graylog from apache.
Since the messages are sent in GELF format, we do not need to create any extractors. Graylog parses and creates fields based on the GELF input. This is one of the advantages of logging using GELF. Similar to nginx logs, we see various fields while expanding individual log.
Configure DB host to send slow query log to graylog server
We do not have any content pack or GELF module for Mysql slow query log. We need to use use Graylog collector sidecar to ship slow query logs from DB host to Graylog. This is achieved by installing Graylog sidecar agent in the DB host and then shipping the log using filebeat.
Lets install the collector sidecar agent in the DB host
$ cd /tmp

$ wget https://github.com/Graylog2/collector-sidecar/releases/download/0.1.0/collector-sidecar_0.1.0-1_amd64.deb

$ sudo dpkg -i collector-sidecar_0.1.0-1_amd64.deb
Create a system service and start it:
$ sudo graylog-collector-sidecar -service install

$ sudo systemctl start collector-sidecar
Before we do further configuration of sidecar in DB host, we need to create a Graylog Beats input for sending logs through filebeat. We also need to create a collector configuration which helps to do configure filebeat input directly from Graylog console without the need to login to our DB host.
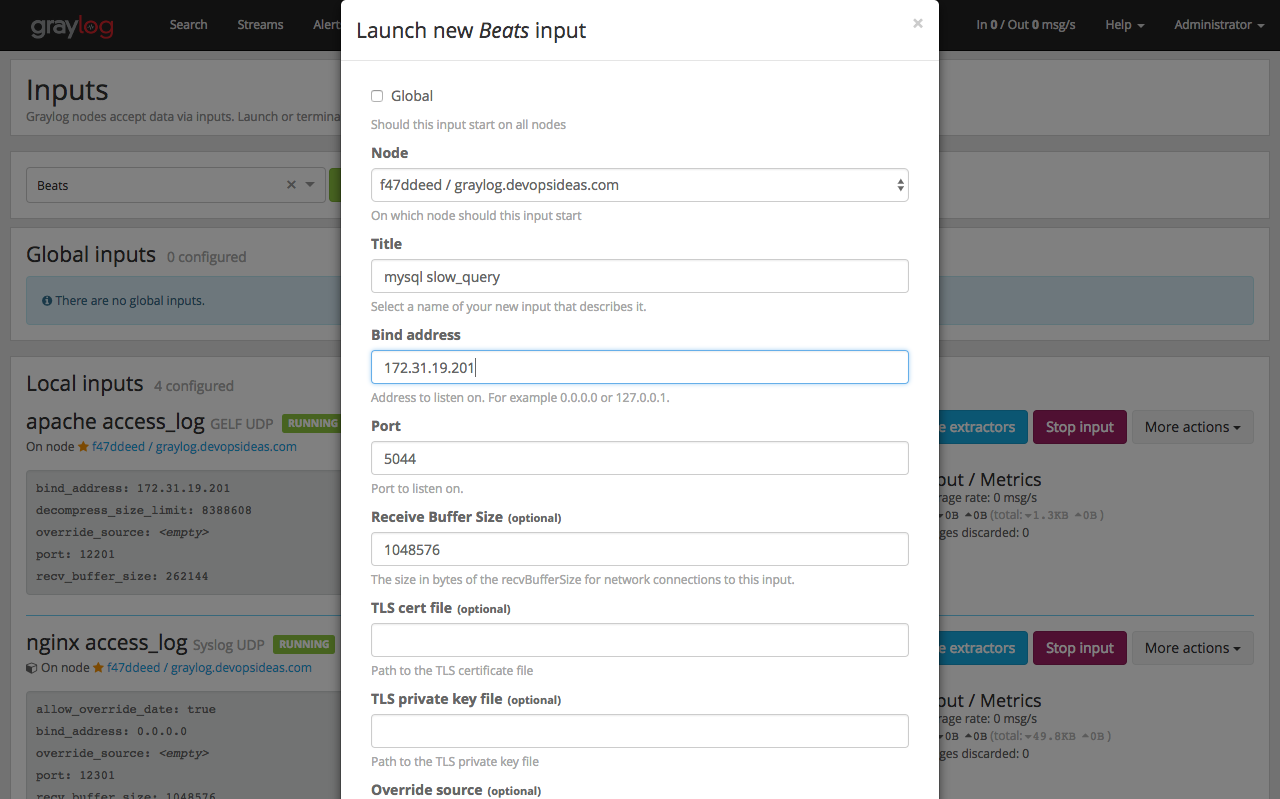
Firstly, lets create Beats Input by navigating to ‘System–>Inputs‘ and then selecting Beats with the below values. Change the Bind address to private IP of your graylog server.
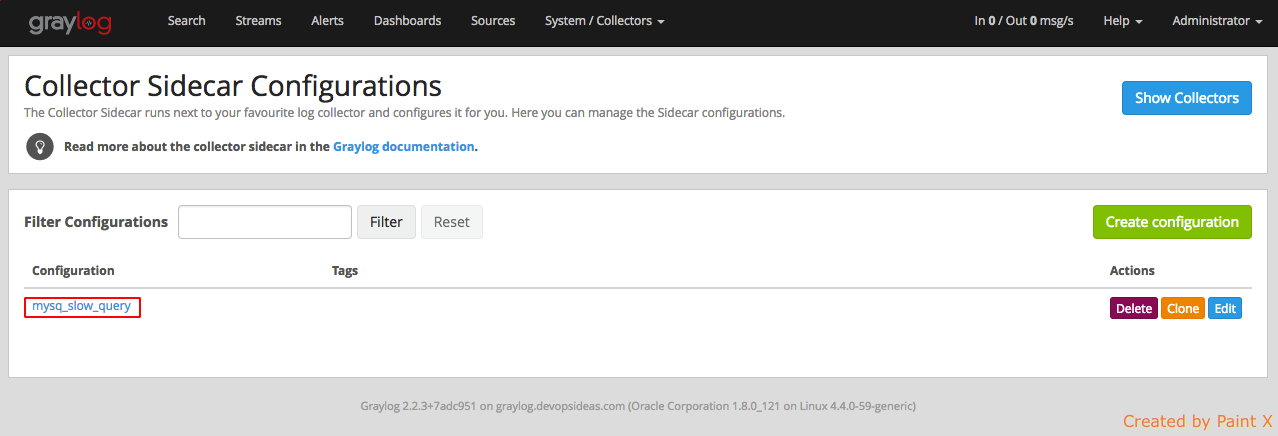
Next we need to create collector input and output configuration. Navigate to the collector configurations. In your Graylog Webinterface click on ‘System → Collectors → Manage configurations’
Next we create a new configuration
Give the configuration a name
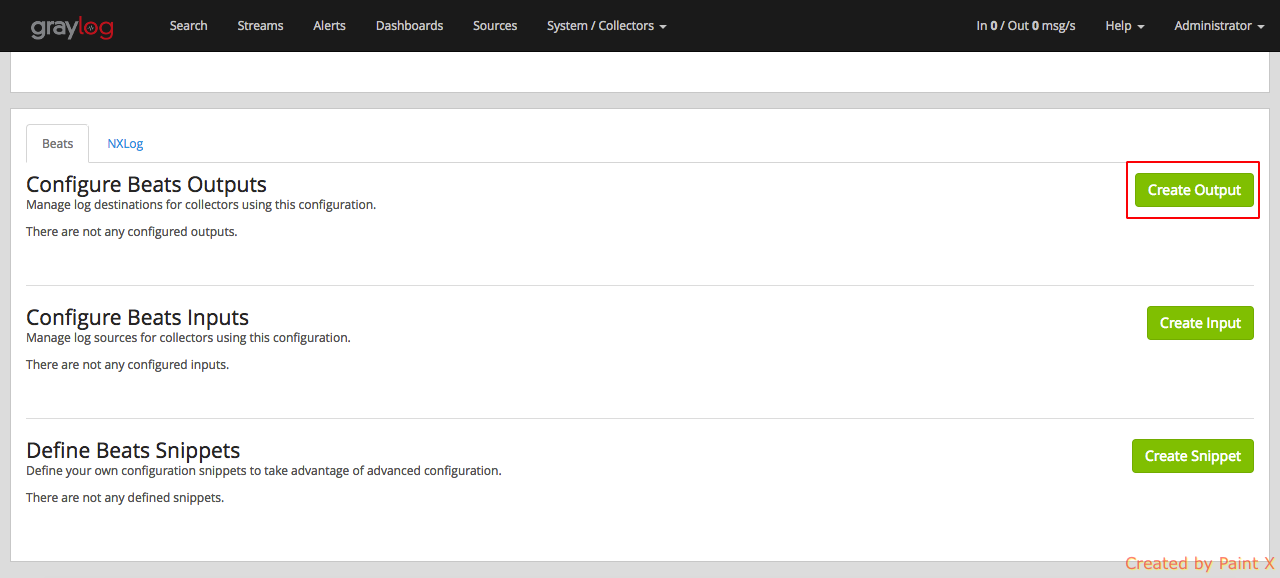
Select the newly created configuration and configure collector input and output
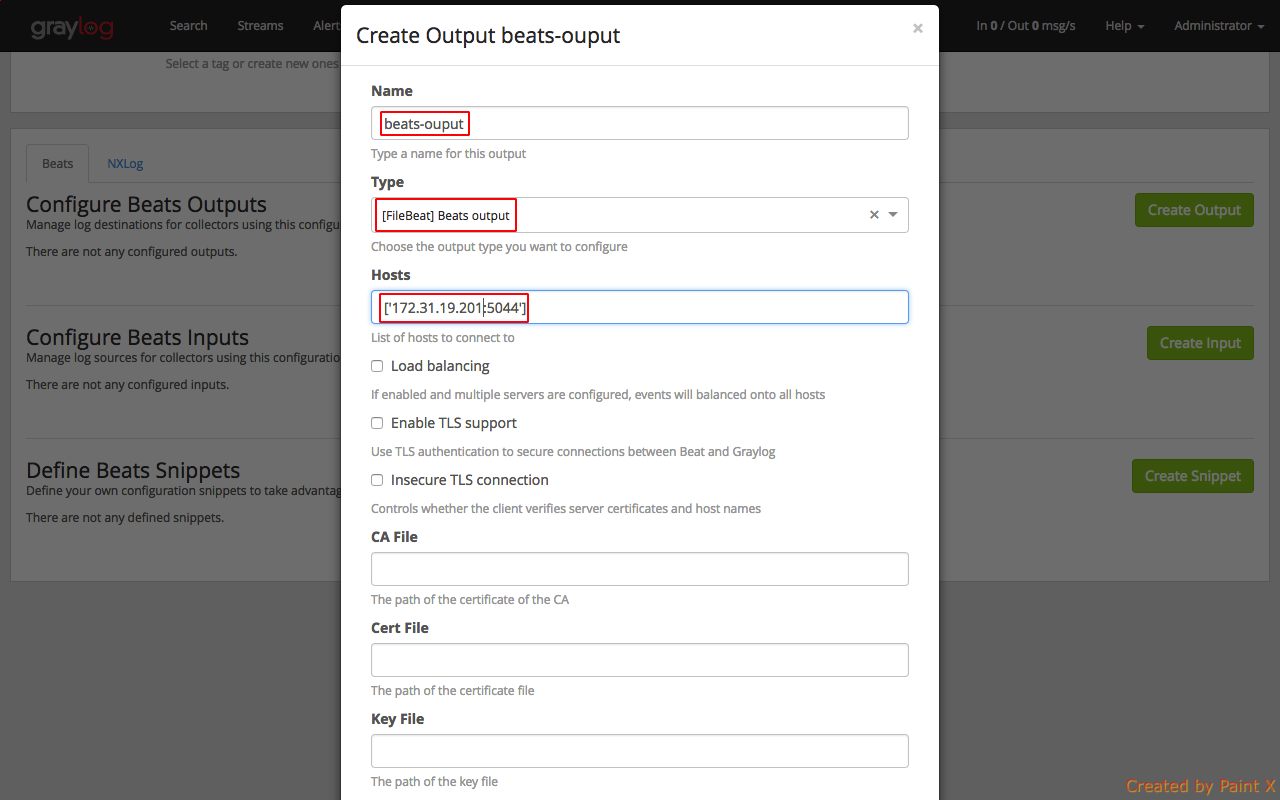
Select ‘Create Ouput’
Fill in the below details. Replace ‘172.31.19.201’ with the private IP of your graylog server anc click Save.
We have configured our collector output.
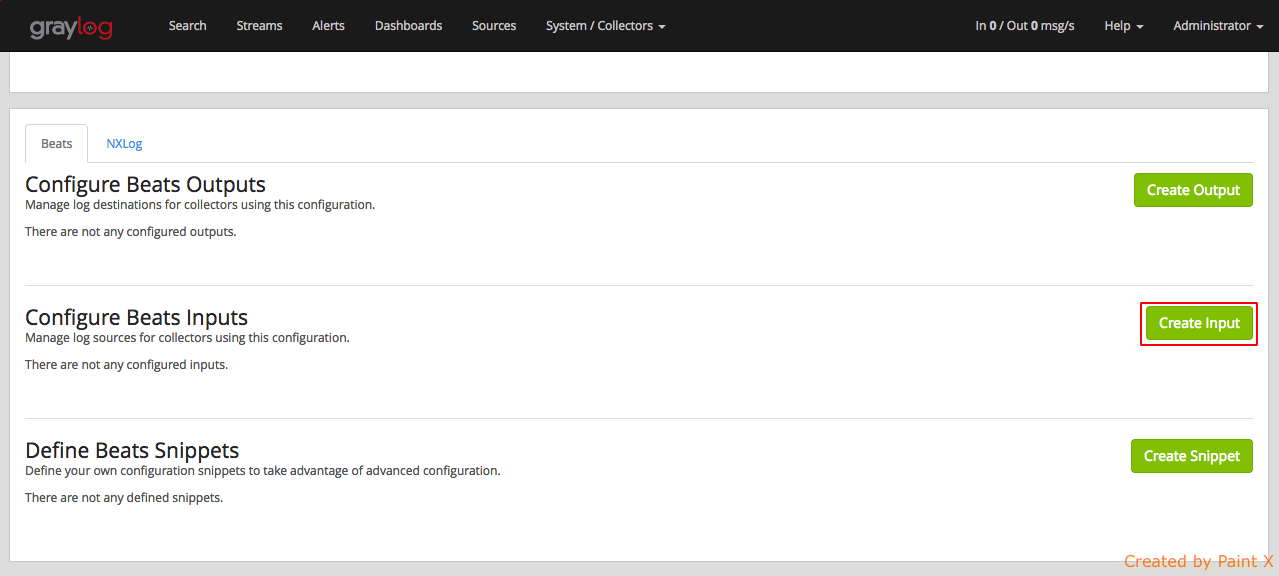
Nex, Select ‘Create Input’
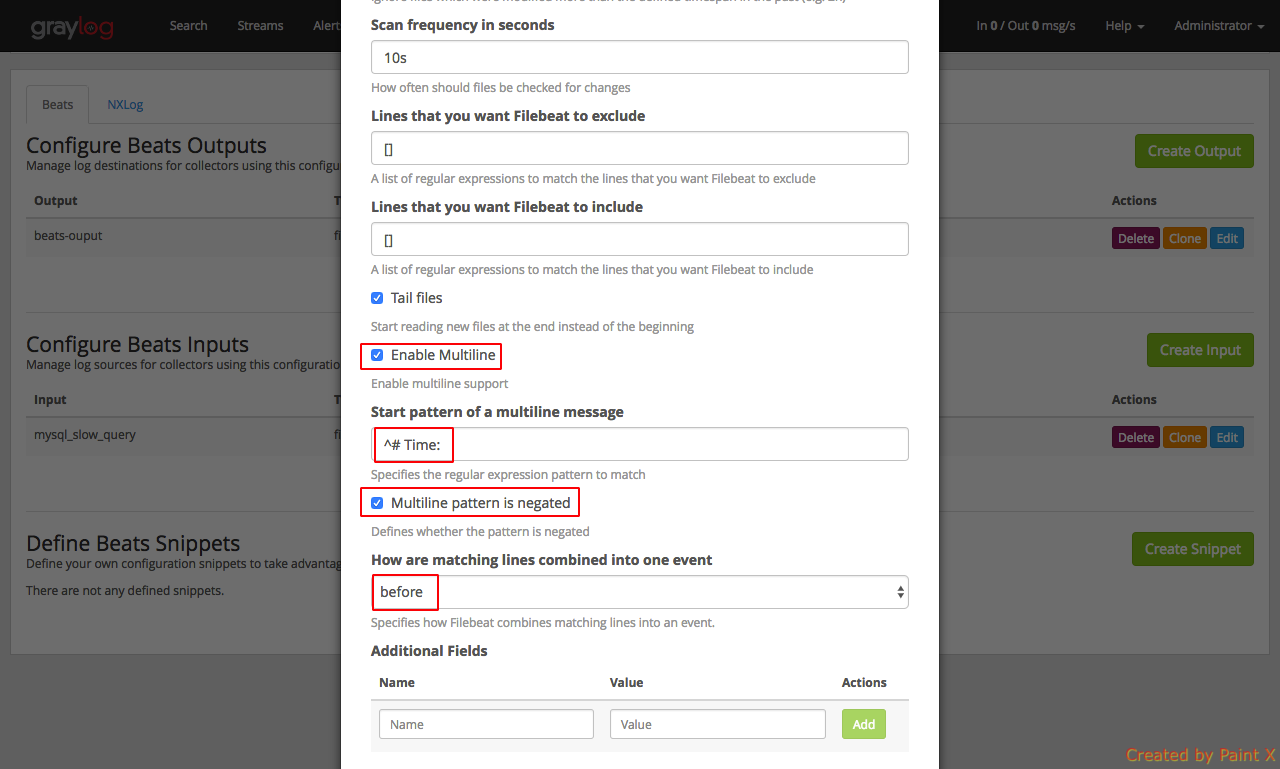
Make sure to fill in the below details for collector input configuration
Name: mysql_slow_query
Forward to (Required): beats-output [filebeat]
Type: [FileBeat] file input
Path to Logfile: [‘/var/log/mysql/mysql-slow.log’]
Type of input file: mysql-slow-query
Enable Multiline: Enable the check box
Start pattern of a multiline message: ^# Time:
Multiline pattern is negated: Enable the check box
How are matching lines combined into one event: before
Few things to note in the above configuration. ‘Path to Logfile‘ should be the path of your slow query log in the DB host. We have enabled mutliline since we will use a grok extractor for our mysql Beats input which requires multiline to be enabled for parsing to work as expected.
Next, we need to set the tag for this collector configuration. Make a note of this since we will use this in the collector sidecar configuration in the DB host. For our example, we will set the tag name as ‘mysq-slow-query’
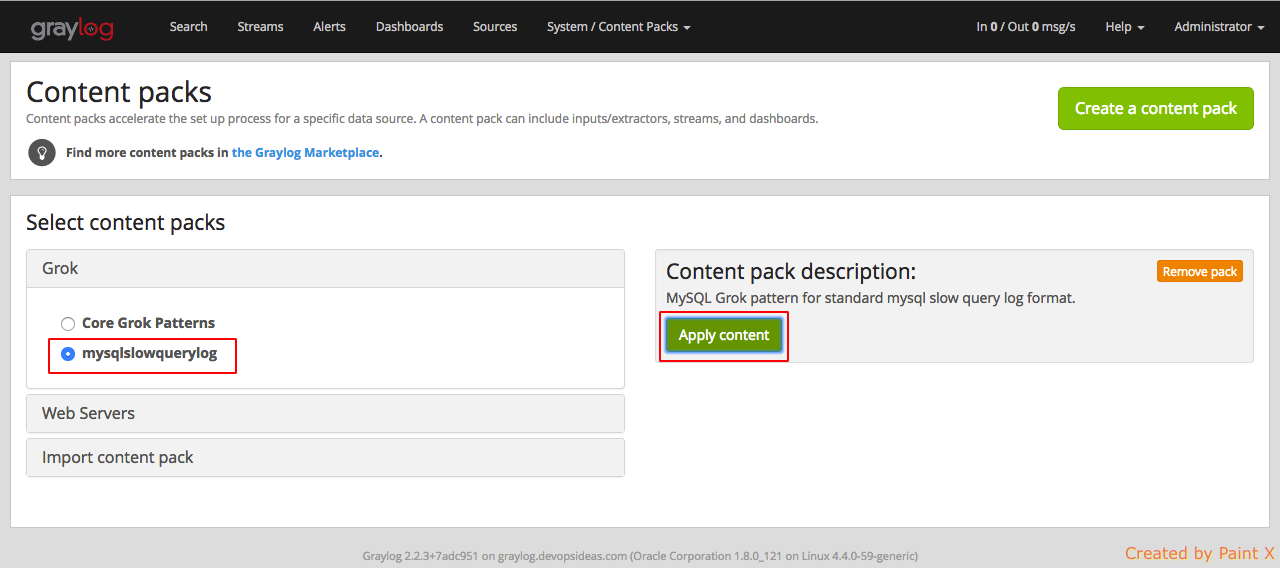
Unlike the content pack for nginx which creates the extractors, for mysql we need to create our own regex/grok extractors. We can make use of MySQL Slow Query LOG GROK pattern for Graylog content pack available in Graylog Market.
We can follow the same steps what we did to download and import nginx content pack for this as well. After importing select the pack which we uploaded and click Apply content
Next, login to DB host to configure collector sidecar to send logs to graylog. Apply the below changes.
$ cd /etc/graylog/collector-sidecar/

$ sudo vi collector_sidecar.yml
collector_sidecar.yml should have the below content.
server_url: http://172.31.19.201/api/
update_interval: 10
tls_skip_verify: false
send_status: true
list_log_files:
    - /var/log/mysql
node_id: graylog-collector-sidecar
collector_id: file:/etc/graylog/collector-sidecar/collector-id
cache_path: /var/cache/graylog/collector-sidecar
log_path: /var/log/graylog/collector-sidecar
log_rotation_time: 86400
log_max_age: 604800
tags:
    - mysql-slow-query
backends:
    - name: nxlog
      enabled: false
      binary_path: /usr/bin/nxlog
      configuration_path: /etc/graylog/collector-sidecar/generated/nxlog.conf
    - name: filebeat
      enabled: true
      binary_path: /usr/bin/filebeat
      configuration_path: /etc/graylog/collector-sidecar/generated/filebeat.yml
Change 172.31.19.201 to your graylog private IP. Make sure the tag name is what you configured earlier (mysql-slow-query)
Restart collector sidecar agent
$ sudo systemctl restart collector-sidecar
Lets check if we are receiving mysql slow query logs by manually simulating slow query using sleep function. I have set the slow query time to 1 sec. Hence any query that crosses 1 sec will trigger a slow query event.
In the DB host,
$ mysql -u root -p
Enter password:
Welcome to the MySQL monitor.  Commands end with ; or \g.
Your MySQL connection id is 8
Server version: 5.7.17-0ubuntu0.16.04.2 (Ubuntu)

Copyright (c) 2000, 2016, Oracle and/or its affiliates. All rights reserved.

Oracle is a registered trademark of Oracle Corporation and/or its
affiliates. Other names may be trademarks of their respective
owners.

Type 'help;' or '\h' for help. Type '\c' to clear the current input statement.

mysql> select sleep (3);
+-----------+
| sleep (3) |
+-----------+
|         0 |
+-----------+
1 row in set (3.00 sec)

mysql>
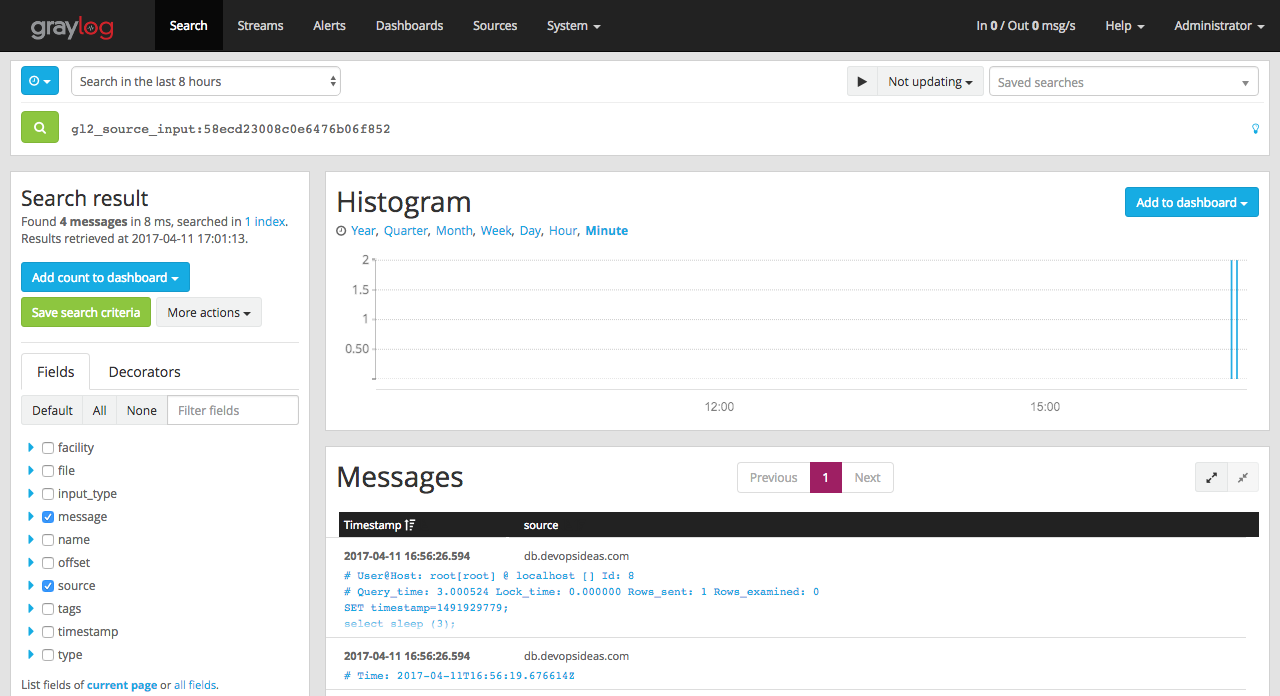
Lets verify if the log gets reflected in graylog by Navigating to System → Inputs → show received messages (mysql slow_query)
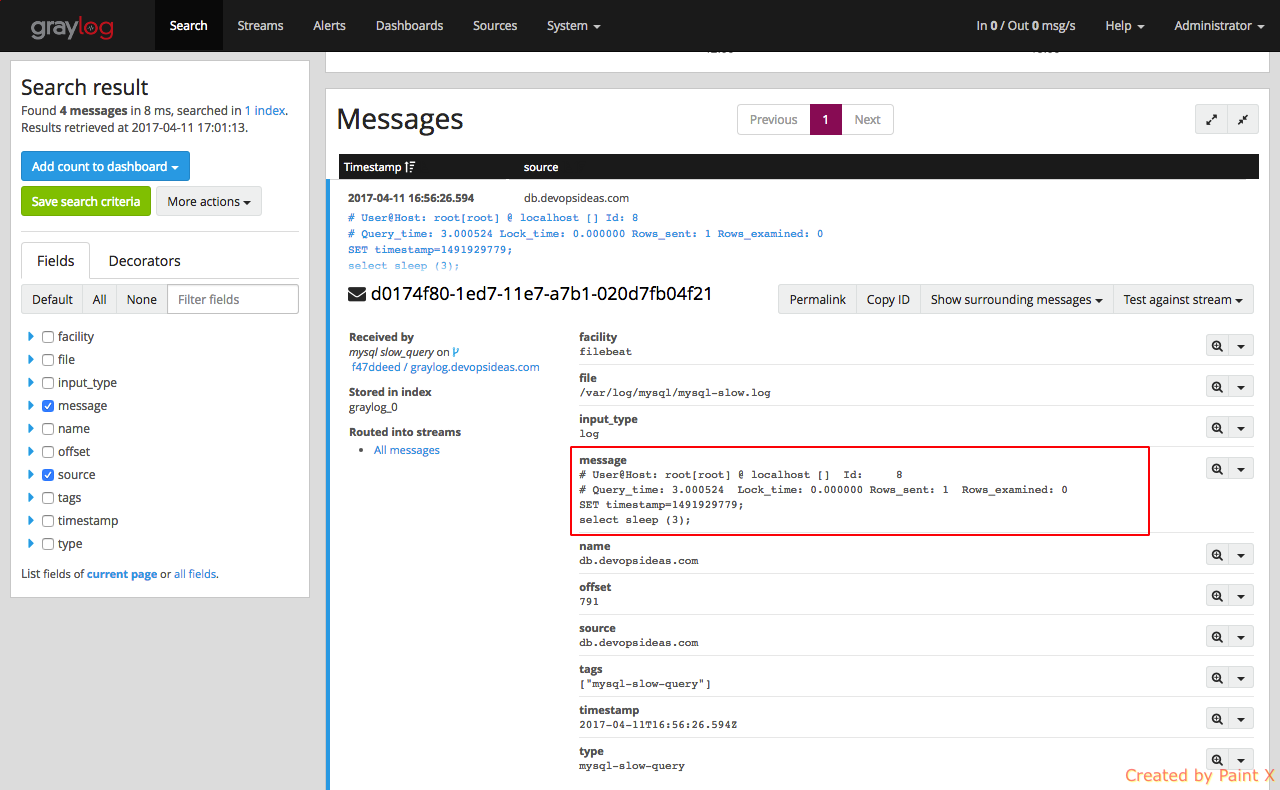
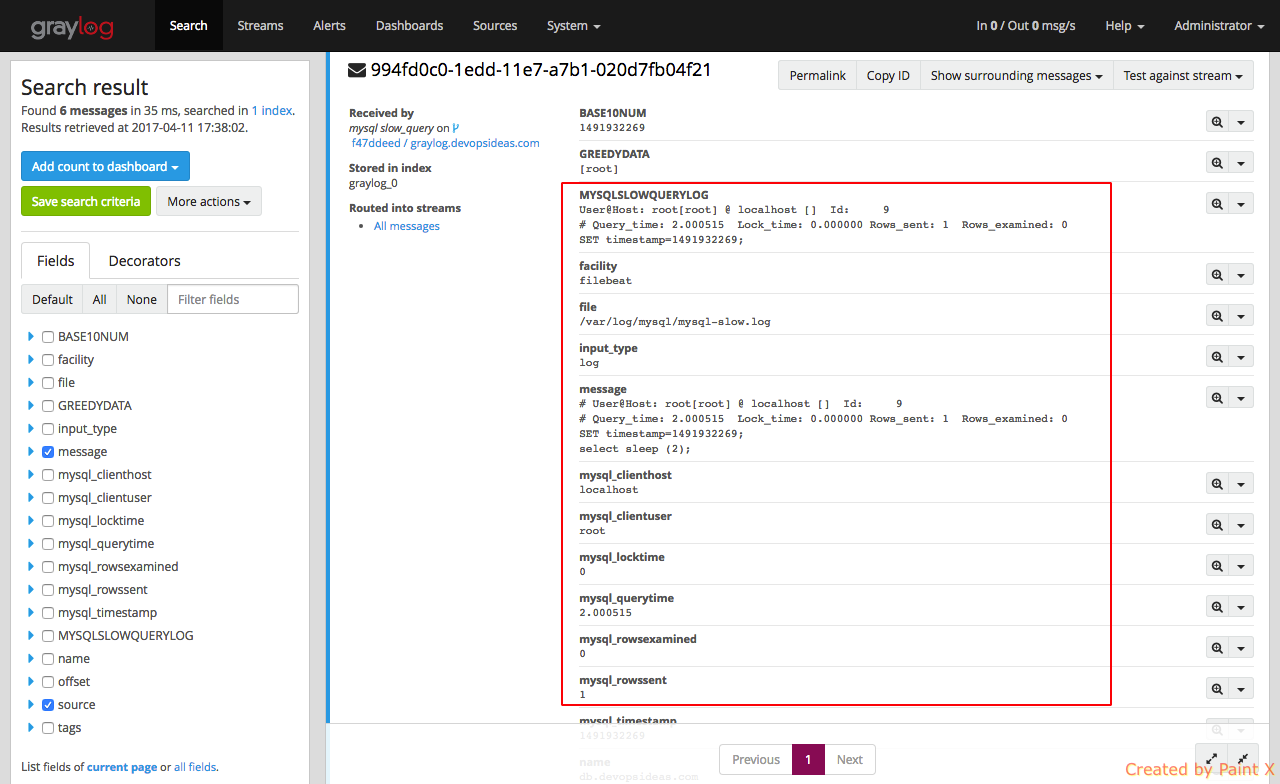
Lets expand the message and see what fields we have got
We can see details like query time, mysql user who executed the query, number of rows examined etc. are not parsed as expected. This is because, we did not apply any extractor to mysql Beat input (mysql slow_query). We can address this by assigning the grok pattern which we imported using a content pack.
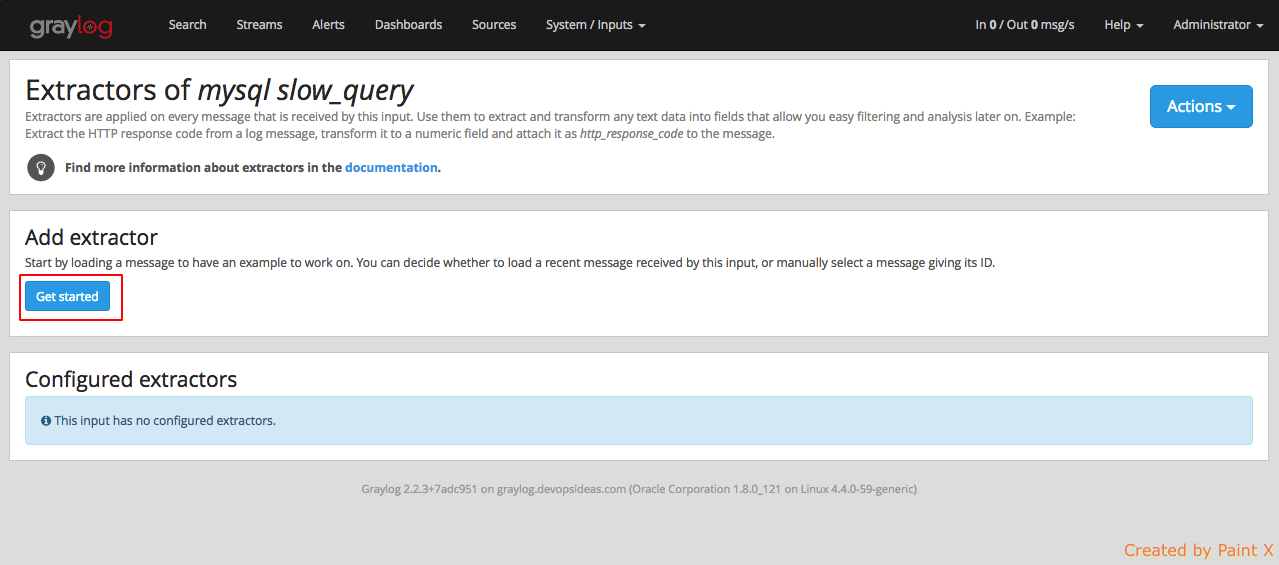
Navigate to System → Inputs → Manage extractor (mysql slow_query) and click Get started
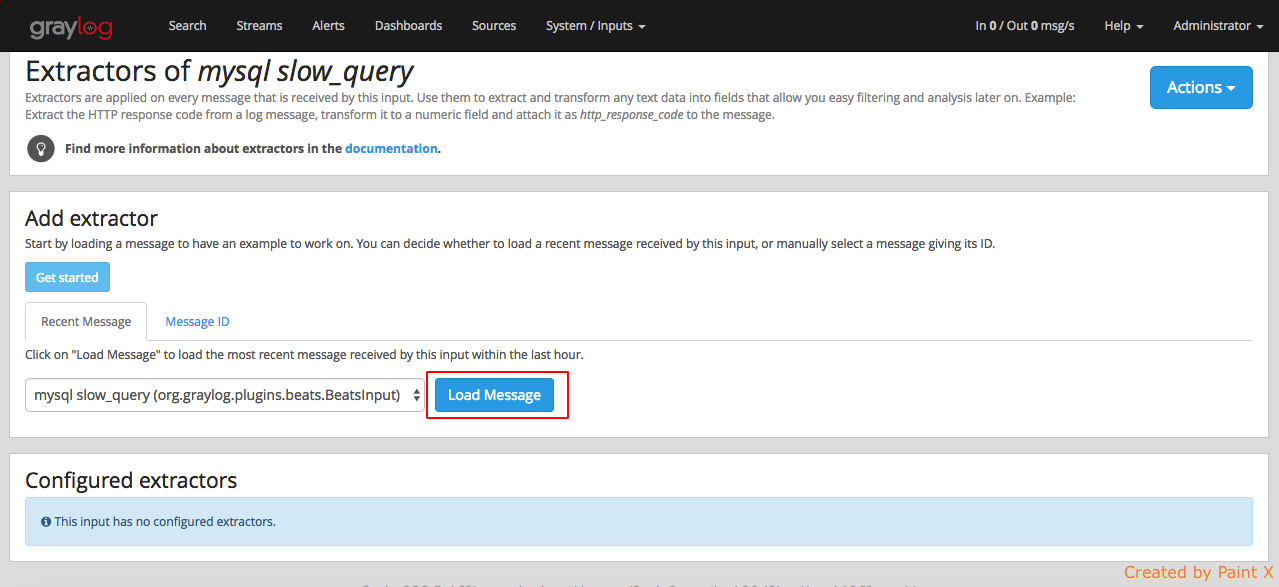
Click Load message for ‘mysql slow_query’ input
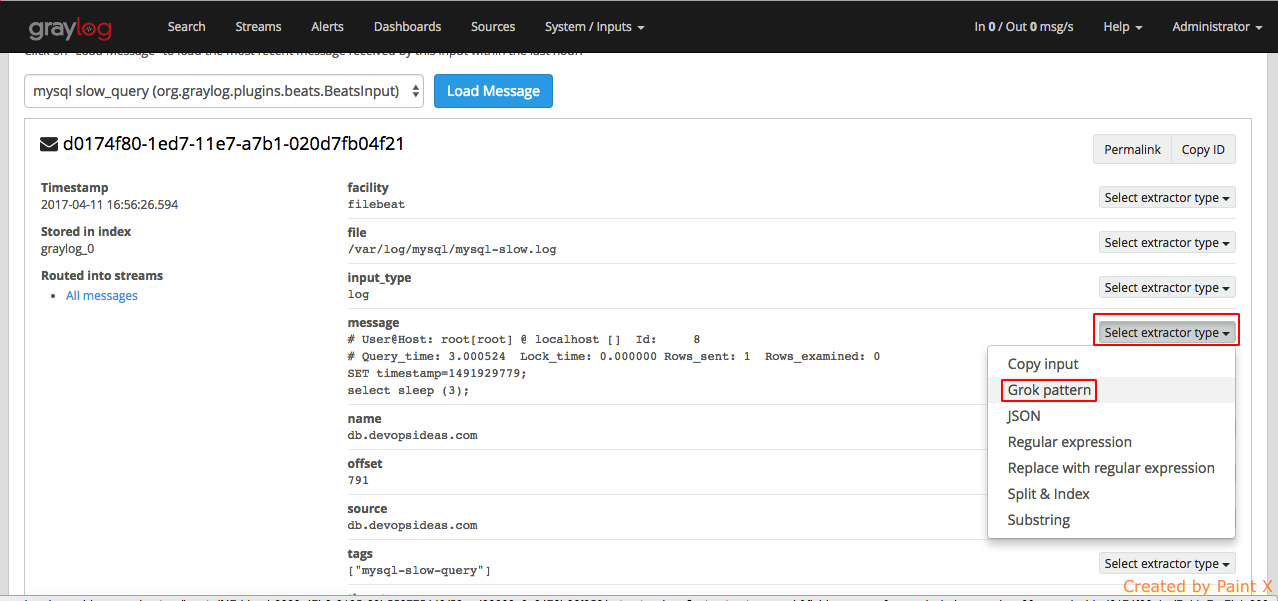
Select the field for which we would like to apply the Grok pattern
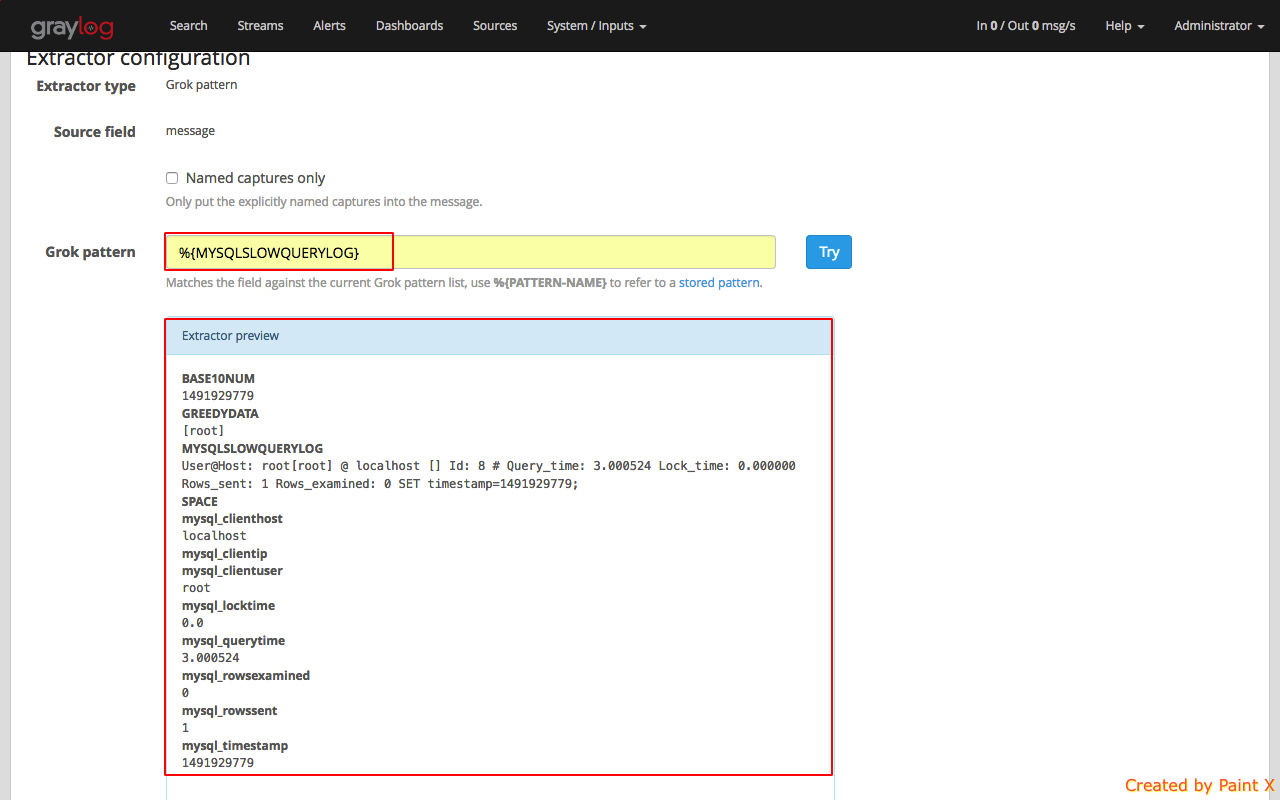
For the Grok Pattern, give ‘%{MYSQLSLOWQUERYLOG}’ and hit Try. You’ll see the extractor preview that show’s how the log will be extracted. Give a title for this extractor and click ‘Update extractor’.
Simulate manual trigger of slow query event and check how the log gets extracted now.
As we can see, there are additional fields compared to how it was earlier. This give use a better insight.
GeoLocation for IP resolution in logs
Graylog lets you extract and visualize geolocation information from IP addresses in your logs. Here we will explain how to install and configure the geolocation resolution, and how to create a map with the extracted geo-information.
In first place, we need to download a geolocation database. We can make use of GeoLite2 City Database which is a free downloadable DB. It is less accurate compared to MaxMind’s GeoIP2 databases which comes at a price.
Download GeoLite2 City Database in the graylog server and place it under ‘/etc/graylog/server/’
$ cd /etc/graylog/server/
$ sudo wget http://geolite.maxmind.com/download/geoip/database/GeoLite2-City.mmdb.gz
$ sudo gunzip GeoLite2-City.mmdb.gz
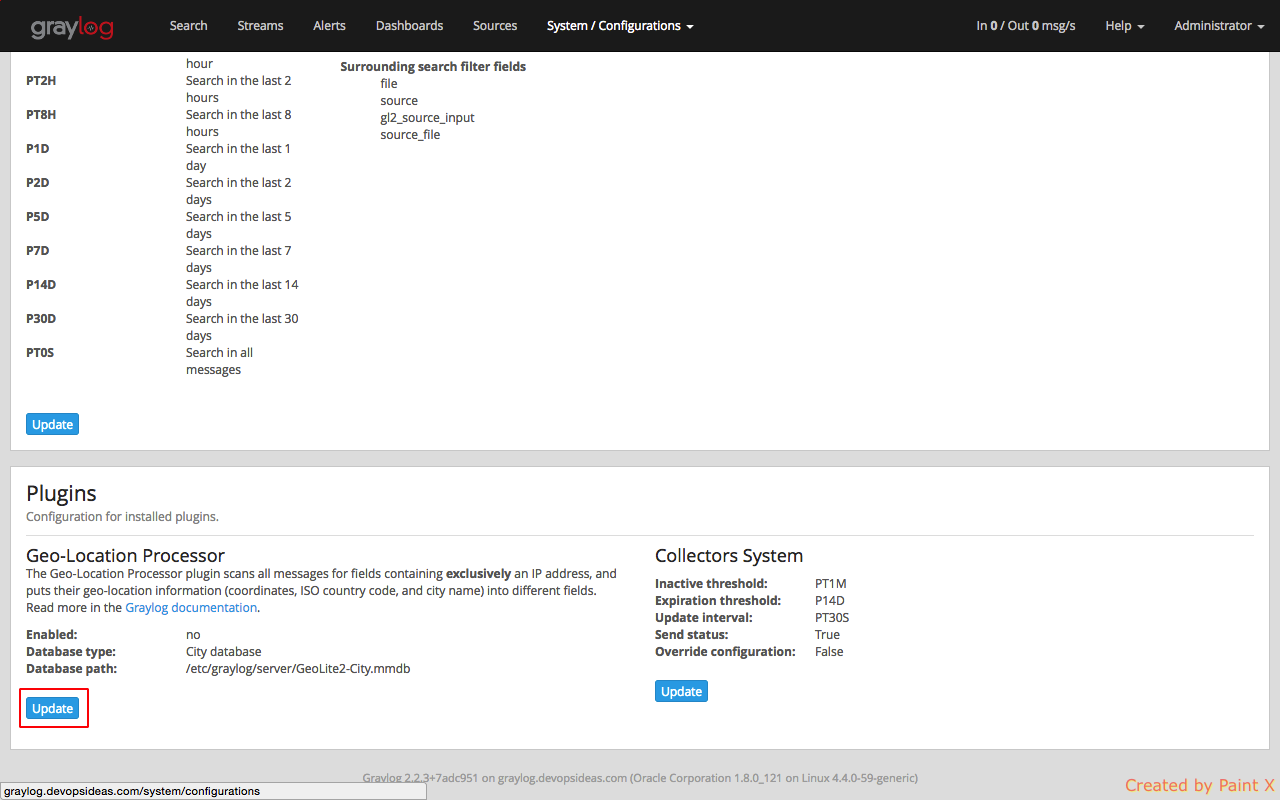
Now, we need to configure Graylog to start using the geolocation database to resolve IPs in your logs. To do that, open Graylog web interface and go to System -> Configurations. You can find the geolocation configuration under the Plugins / Geo-Location Processor section, as seen in the screenshot.
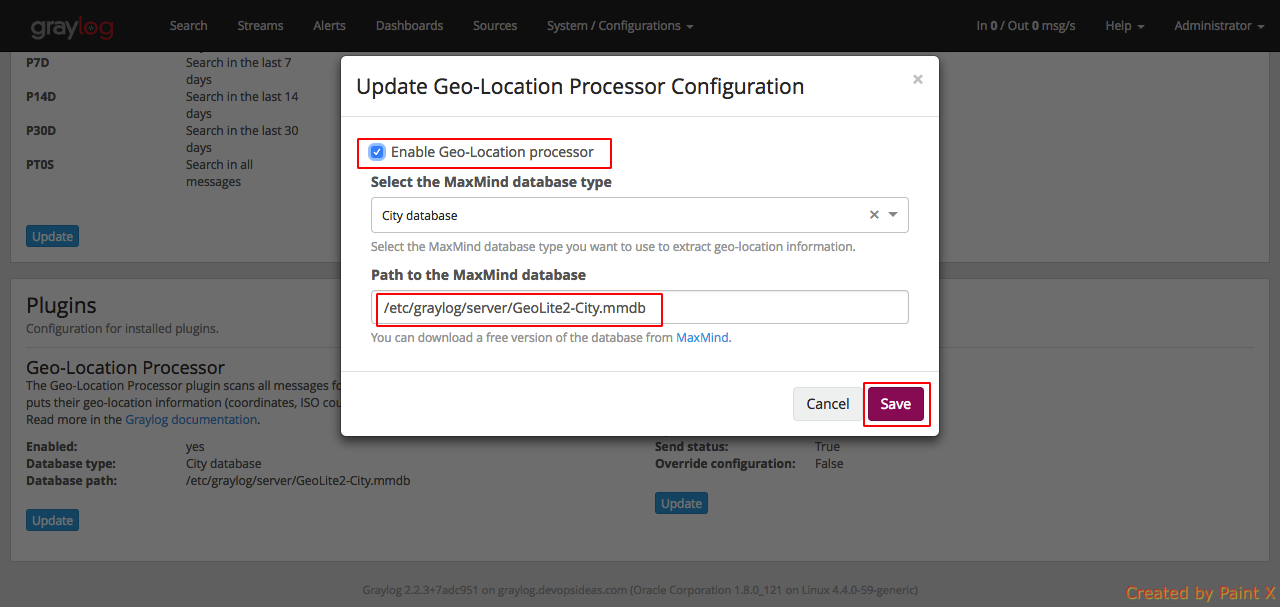
In the configuration modal, check the Enable geolocation processor, and enter the path to the geolocation database. Click Save when you are done.
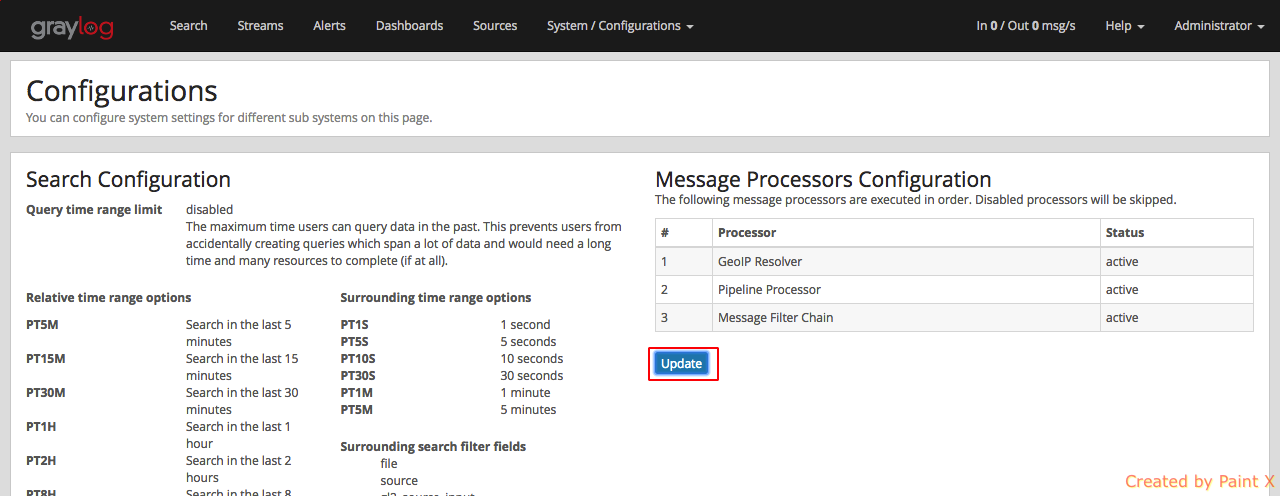
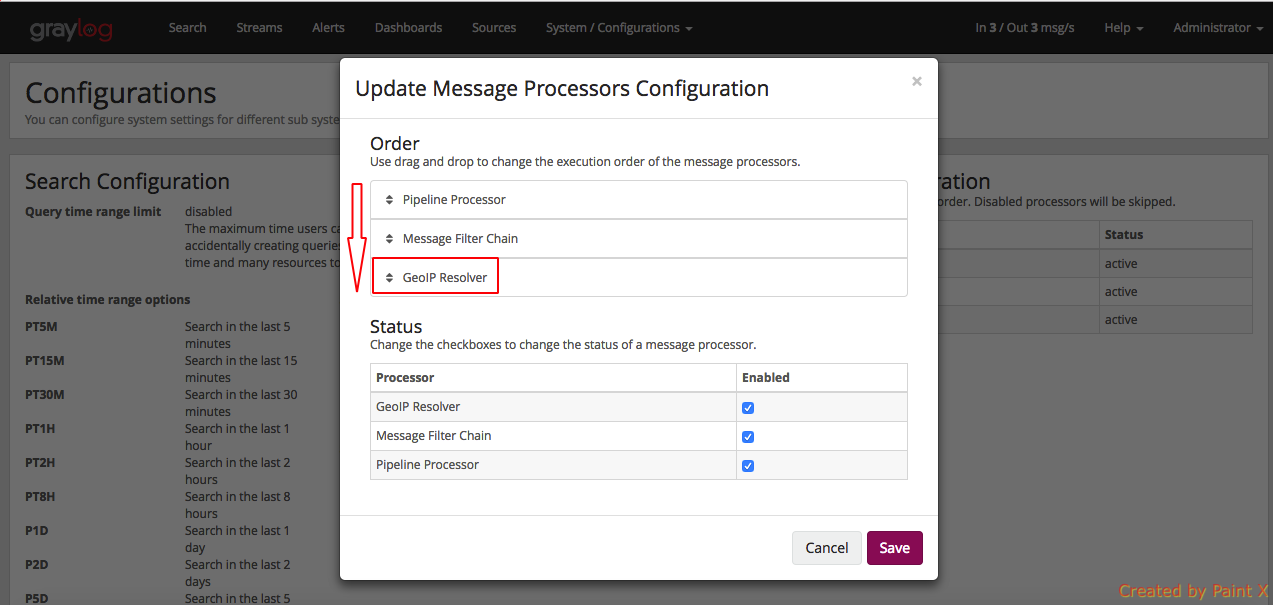
The last step before being able to resolve locations from IPs in our logs, is to activate the GeoIP Resolver processor. In the same System -> Configurations page, update the configuration in the Message Processors Configuration section.
In that screen, you need to enable the GeoIP Resolver, and you must also set the GeoIP Resolver as the last message processor to run, if you want to be able to resolve geolocation from fields coming from extractors.
That’s it, at this point Graylog will start looking for fields containing exclusively an IPv4 or IPv6 address, and extracting their geolocation into a <field>_geolocation field.
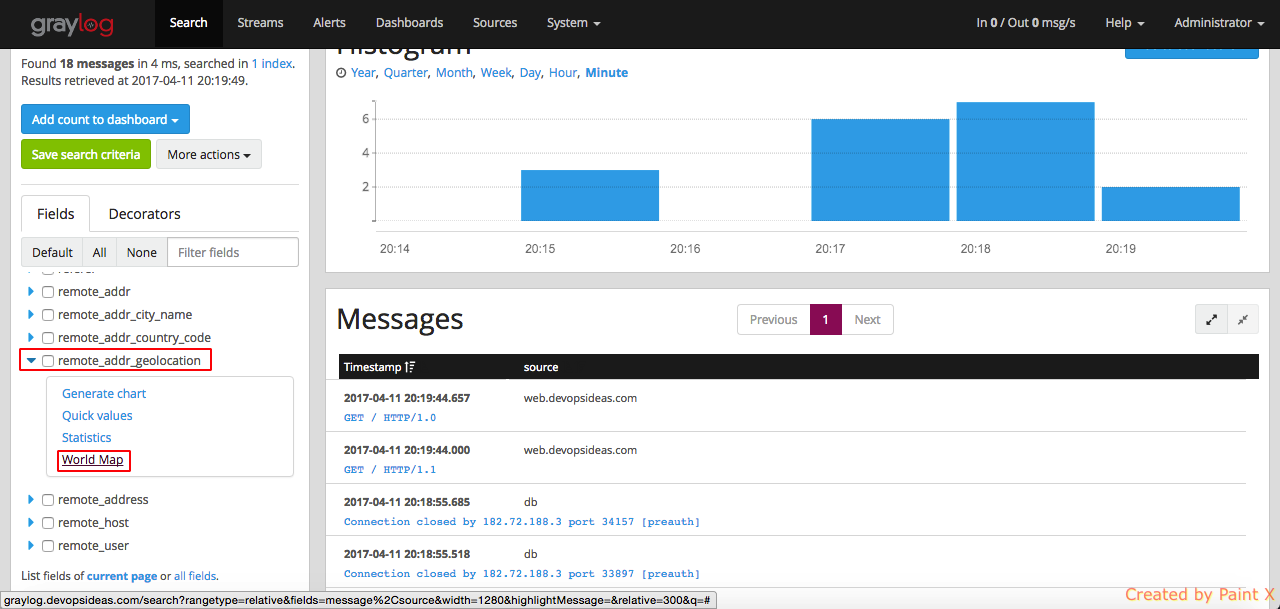
We can verify this by opening the graylog web interface and remote_addr_geolocation–>World Map in the Fields section.
The map indicates that the requests have come from Chennai city. This gives us a great advantage to prevent hack attempts by identifying the ip’s which are not clean and blocking them.
Setting up Alert
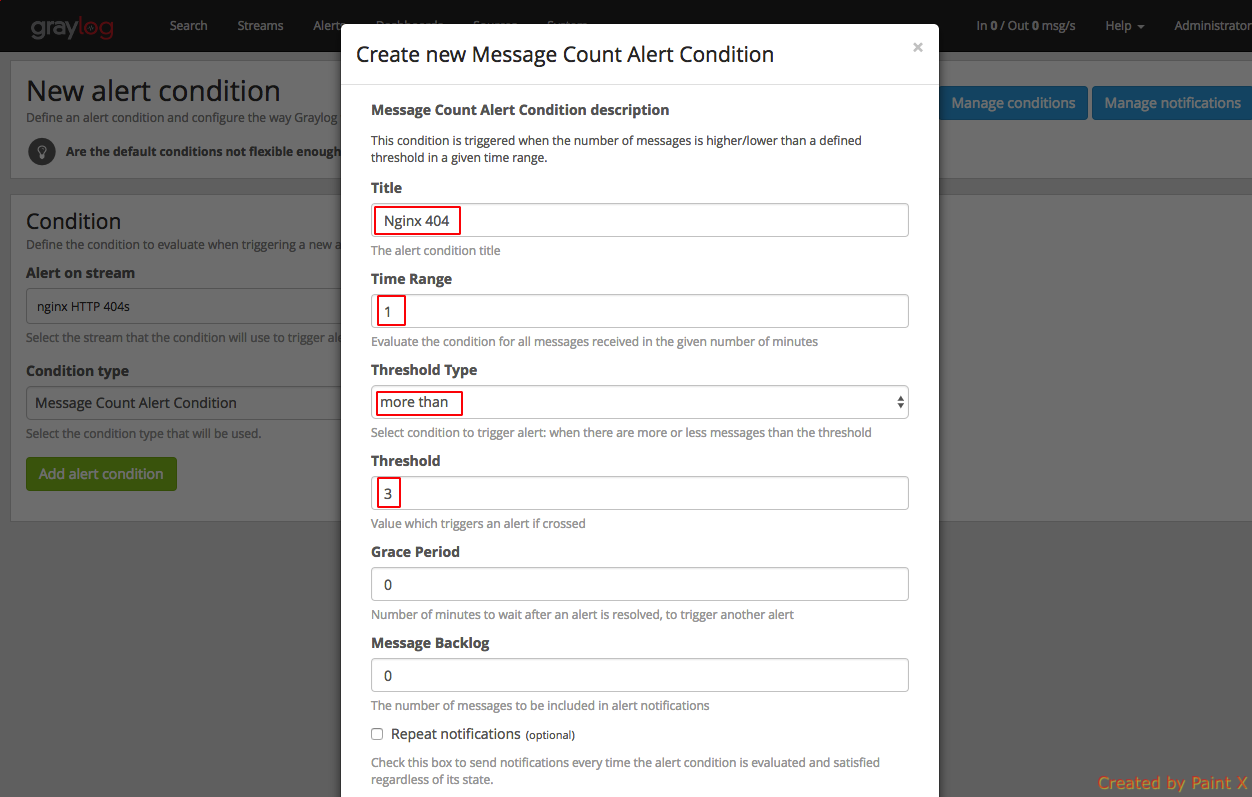
For setting up alert, we need to have streams configured. We already have streams created as part of nginx content pack. Let us create an alert based on the condition that an email has to be sent if the number of 404 errors reaches a count of 3 within a timespan of 1 min.
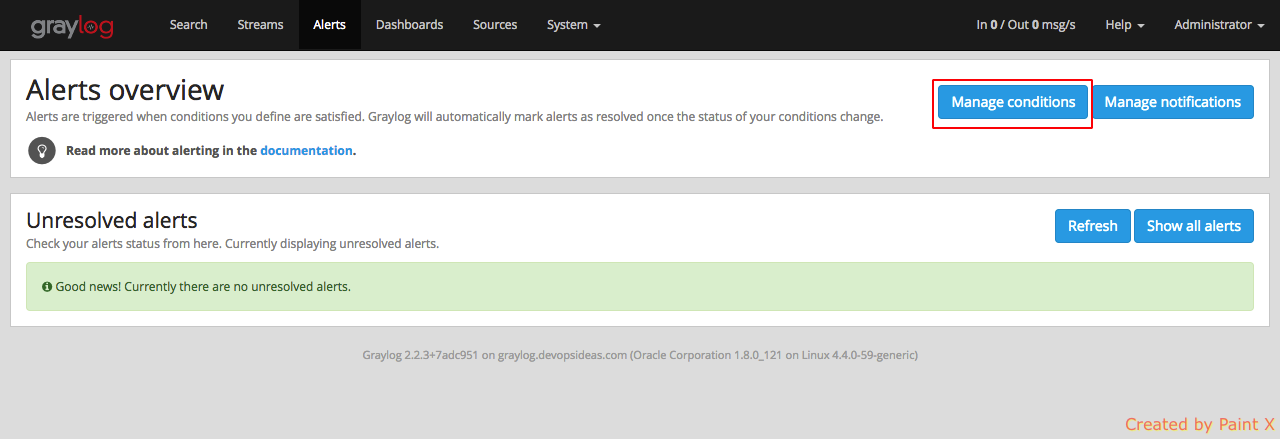
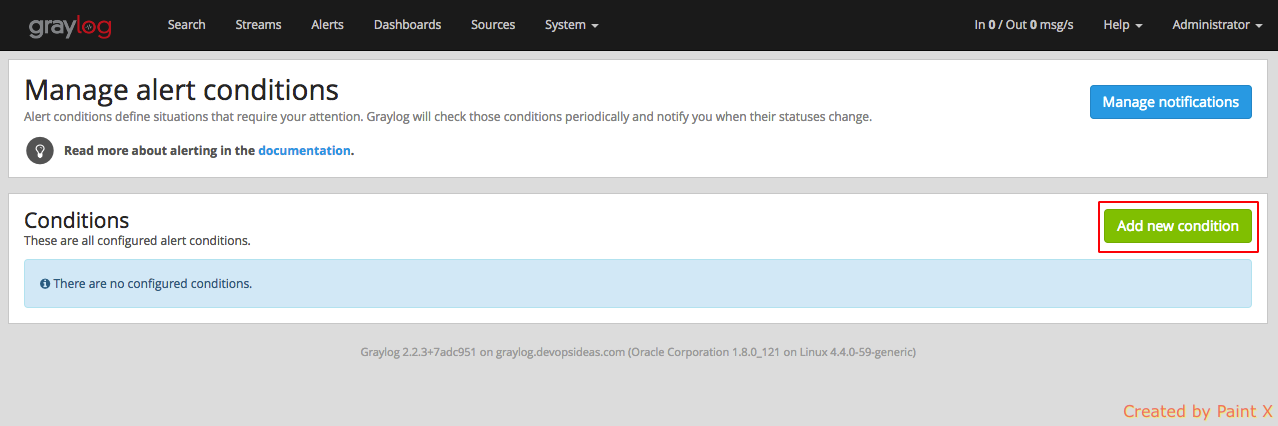
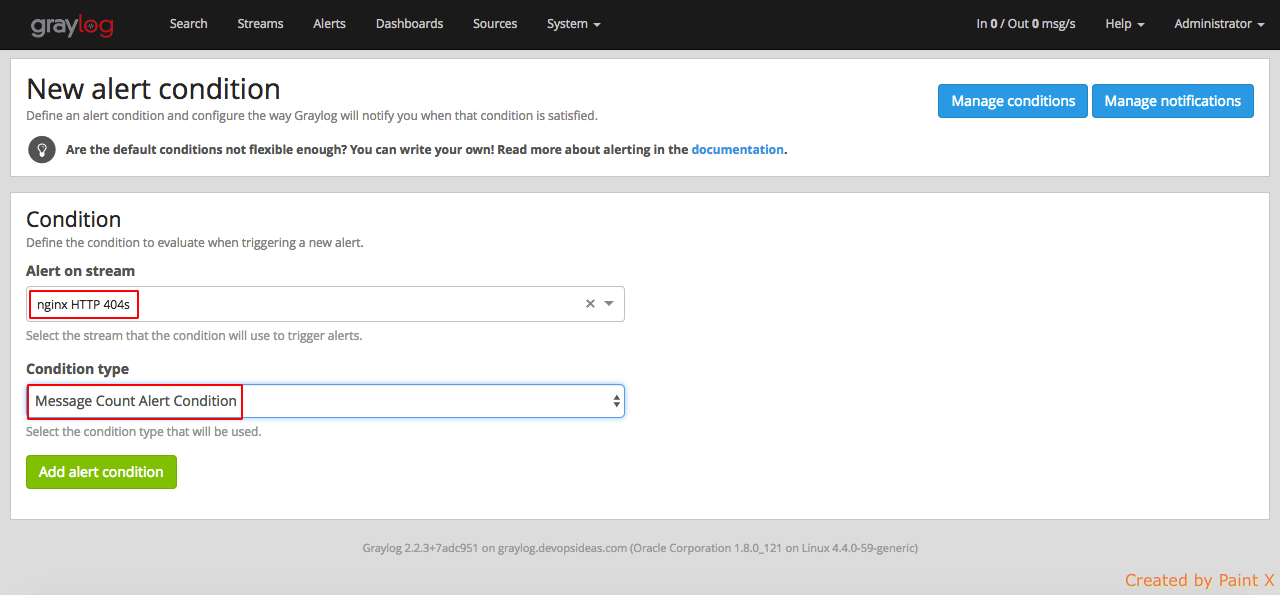
Navigate to Alerts–>Manage conditions–>Add new condition
In the next page, select the bleow,
Alert on stream : nginx HTTP 404s
Condition type: Message Count Alert Condition
After clicking ‘Add alert condition’ you will be asked to set the condition to alert. Give the values as in the screenshot below
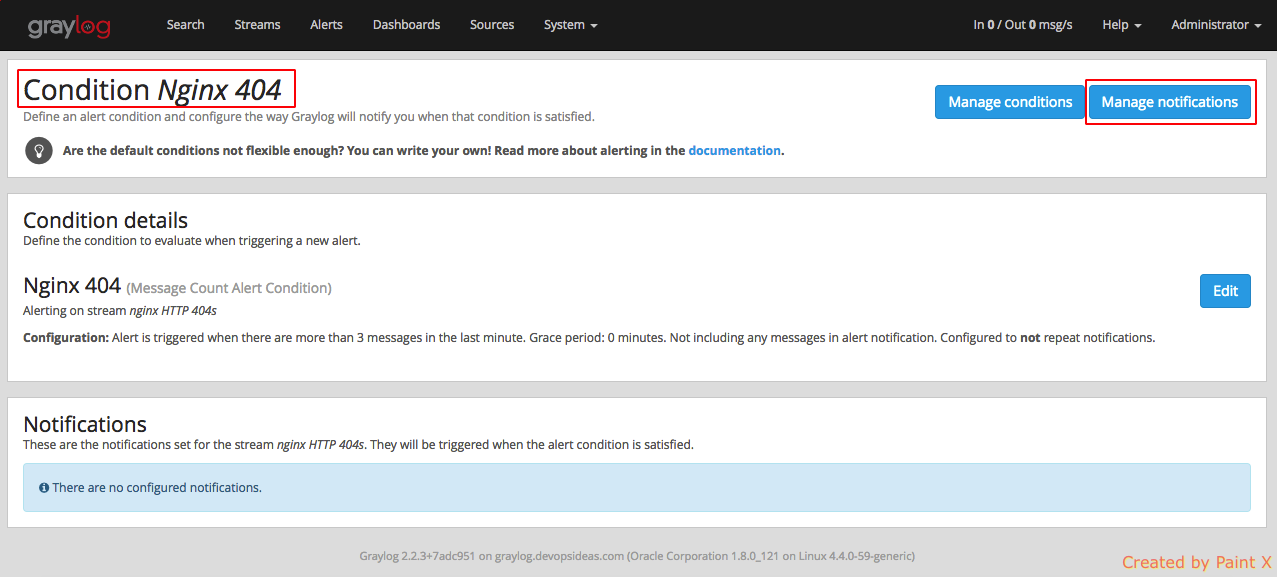
Next we need to create notifications for this alert. Click ‘Manage notifications’ for the alert which we created above.
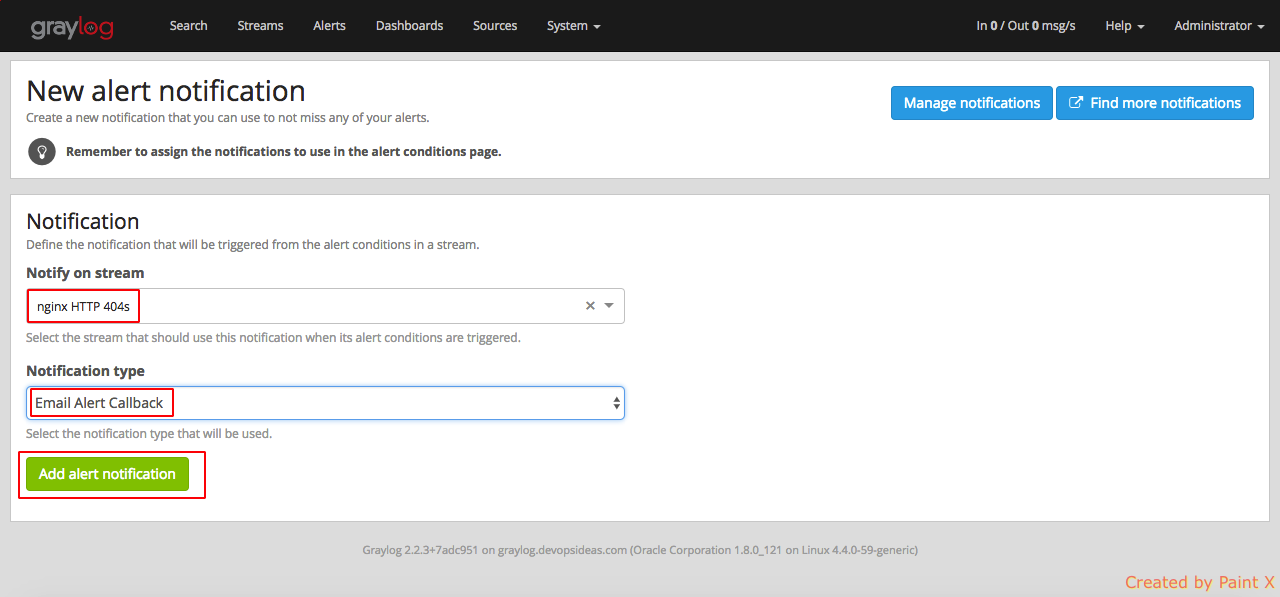
Click ‘Add new notification’ and add the below values in the subsequent page
Notify on stream: nginx HTTP 404s
Notification Type: Email Alert Callback
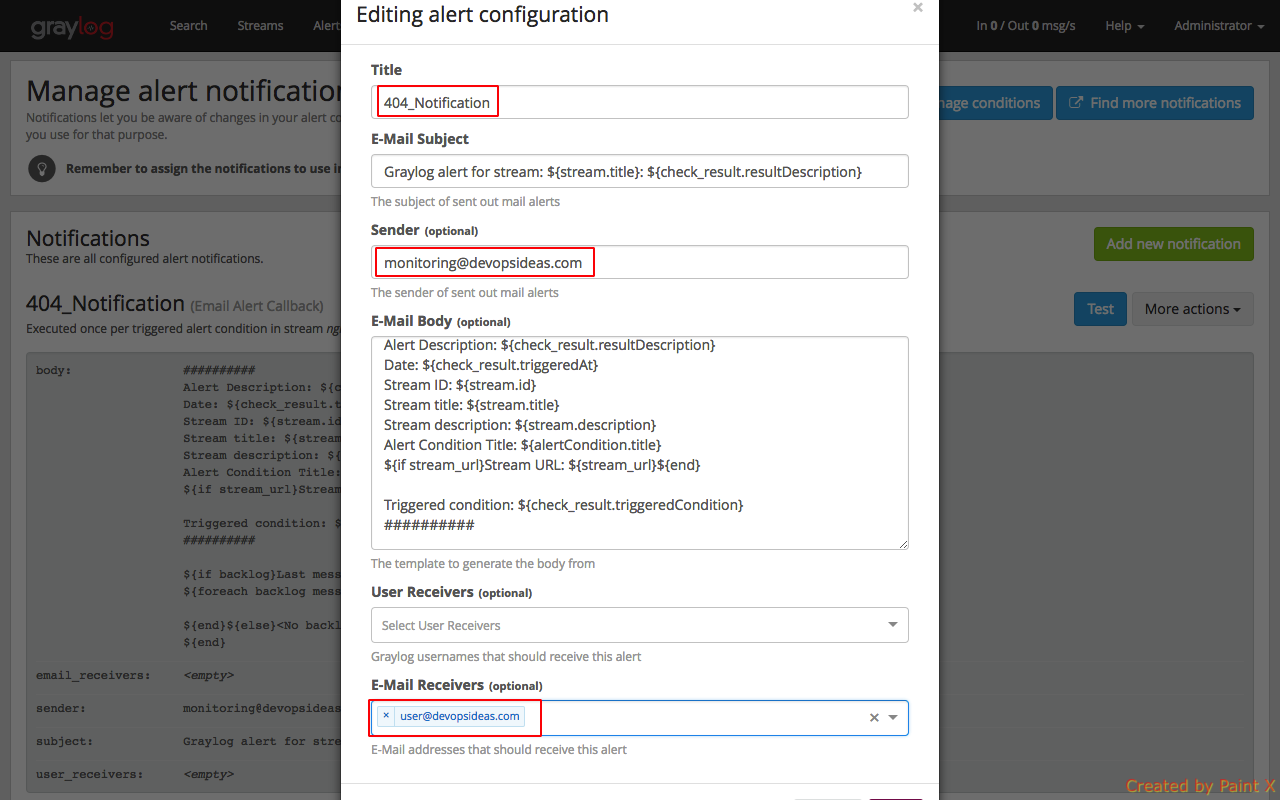
In the next page, give the name for notification and other values as per your need.
You can do a Test on the newly created notification to see if it works. You can also integrate other alert mechanisms like sms and call using Twilio and other 3rd party tools.
Using this method we can set various alert conditions for various log files and get notified whenever there is a problem.
Note: For emails to work, you should have completed SMTP configuration in your graylog server. If you had it configured, then you’ll receive a mail whenever the alert condition satisfies.
User Access Control
Graylog provides inbuilt user access control which gives it an edge over ELK. You can also integrate it to your own cutom LDAP or Active Directory. For our example, we will go with the default option.
In order to provide access to users, we should have streams created for the respective logs for which you want to provide access to.
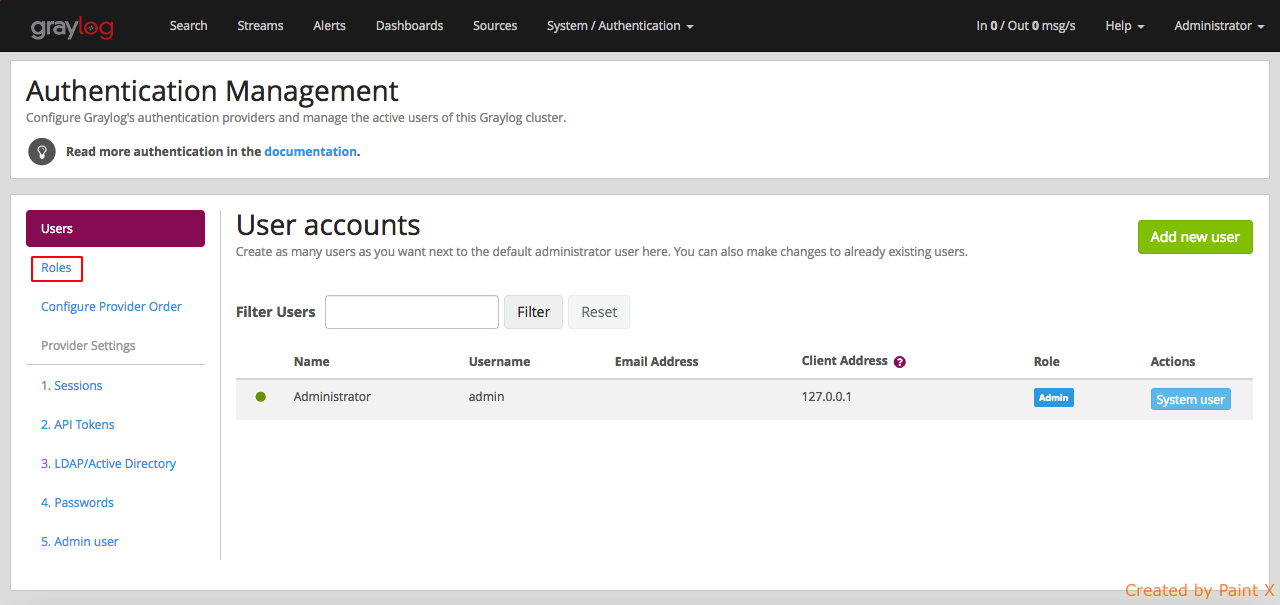
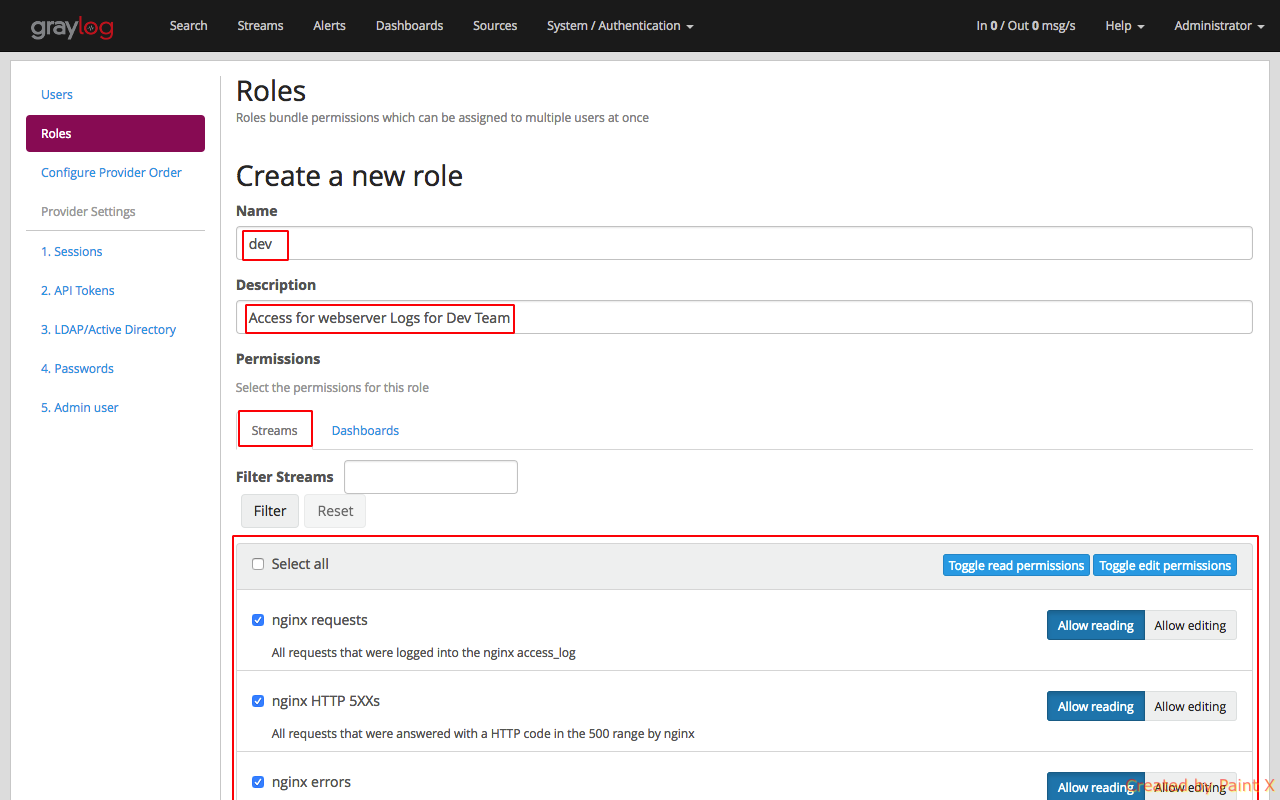
Navigate to System–>Authentication. We will first create a Role and then assign it to a user later.
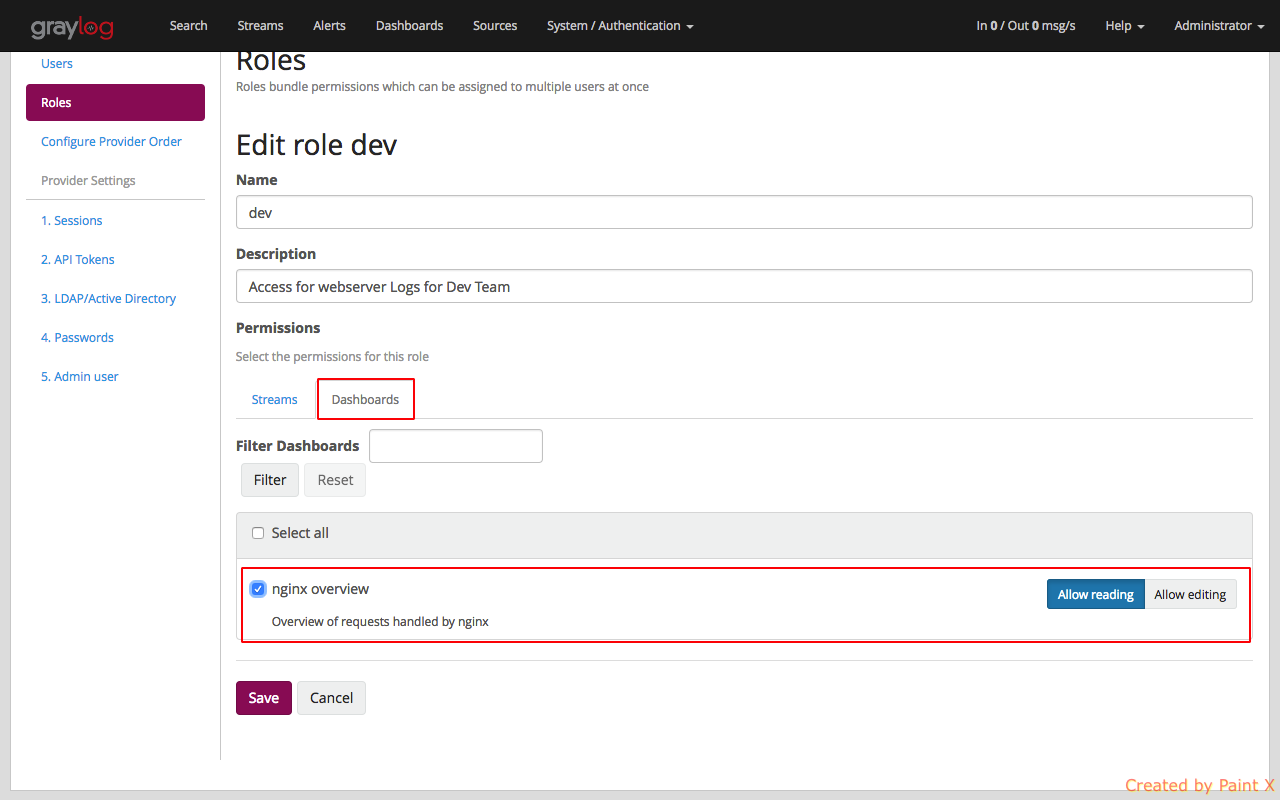
Give the role a name and a description. We will then provide Read access to all the nginx streams and dashboard.
Lets create a user and assign the role which we created above.
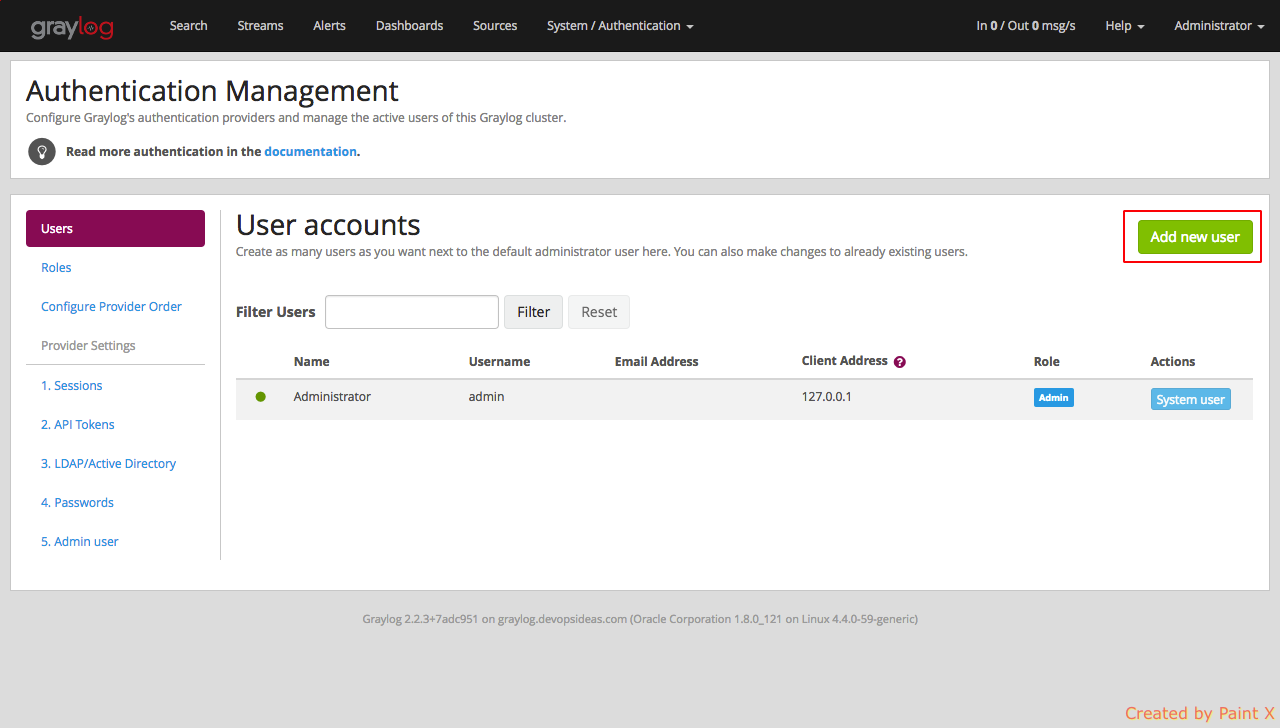
Select Users and click ‘Add new User’
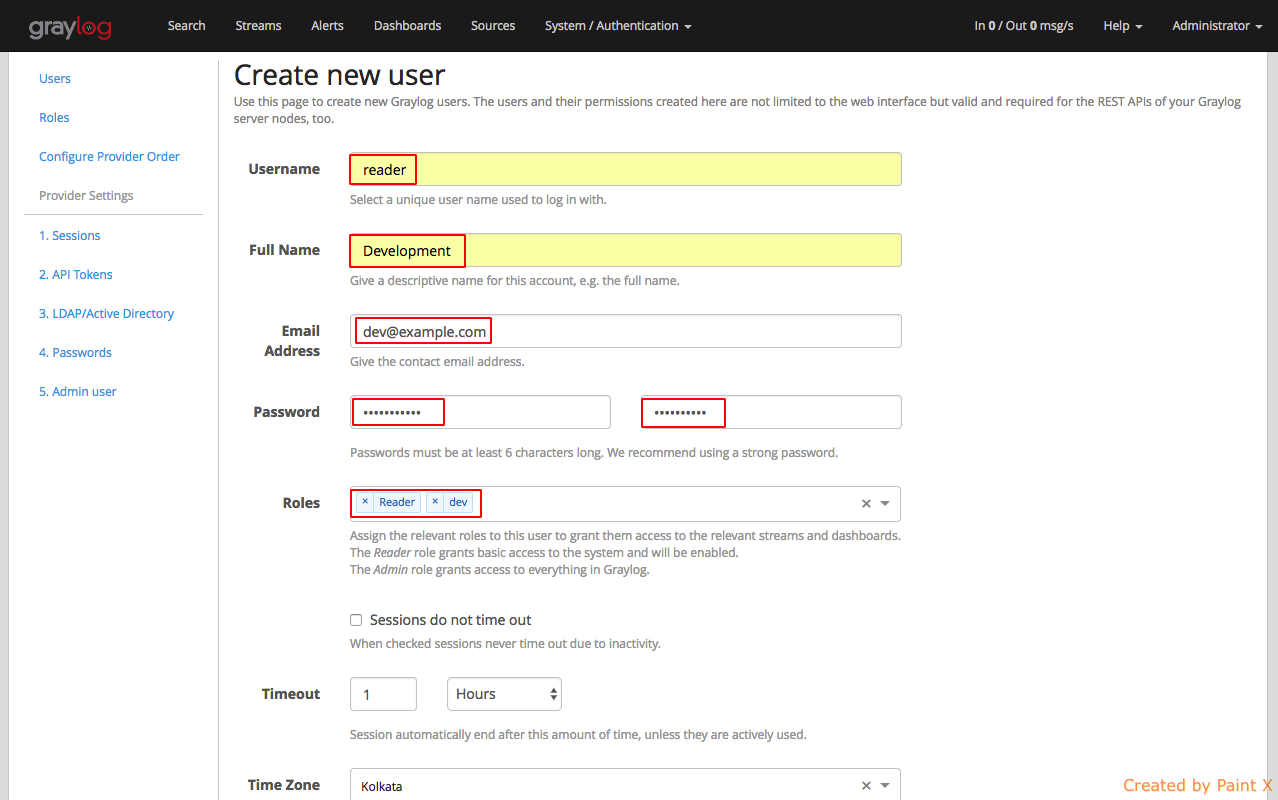
Fill in the details for the user as below. Assign the role that we created for this user.
That’s it, we can try logging in as the user ‘reader’ and see how the web interface looks like.
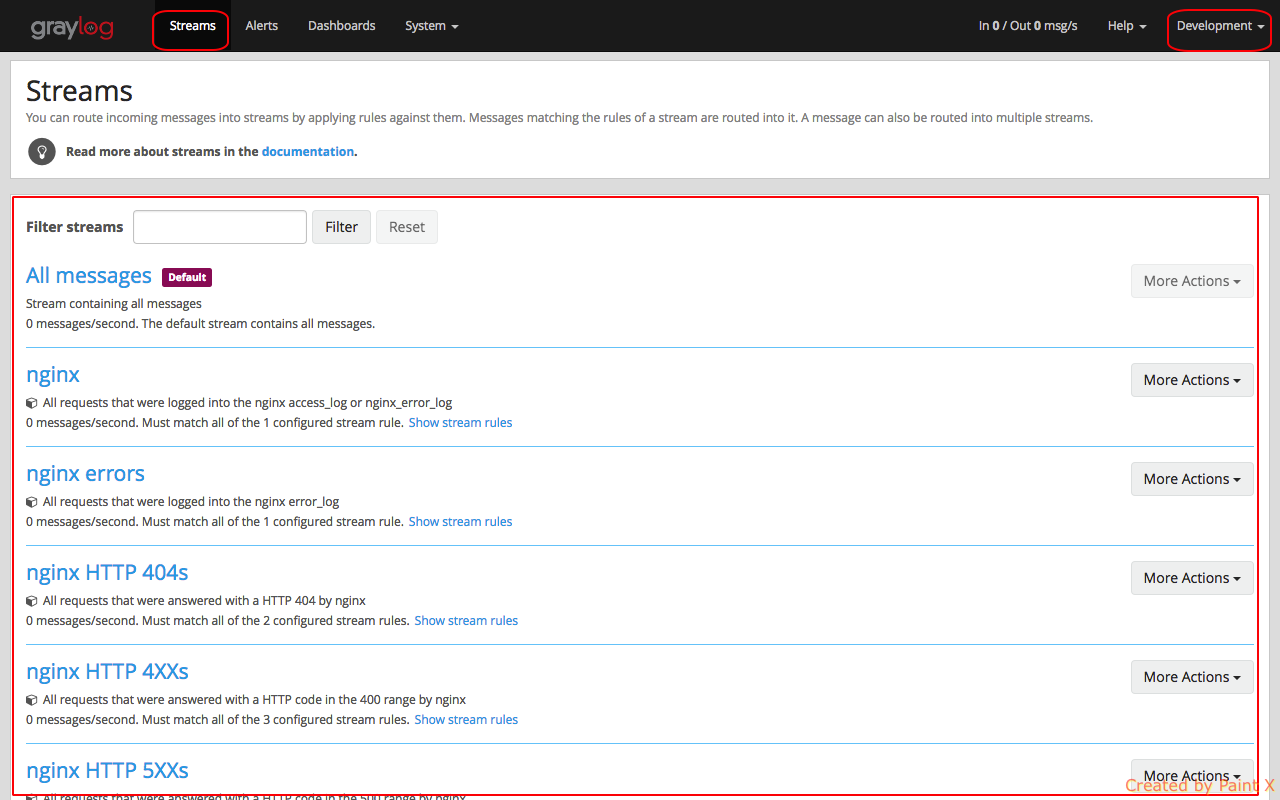
Logging in as reader, we directly get list of avaiable streams that we have access for. We do not see the global search option.
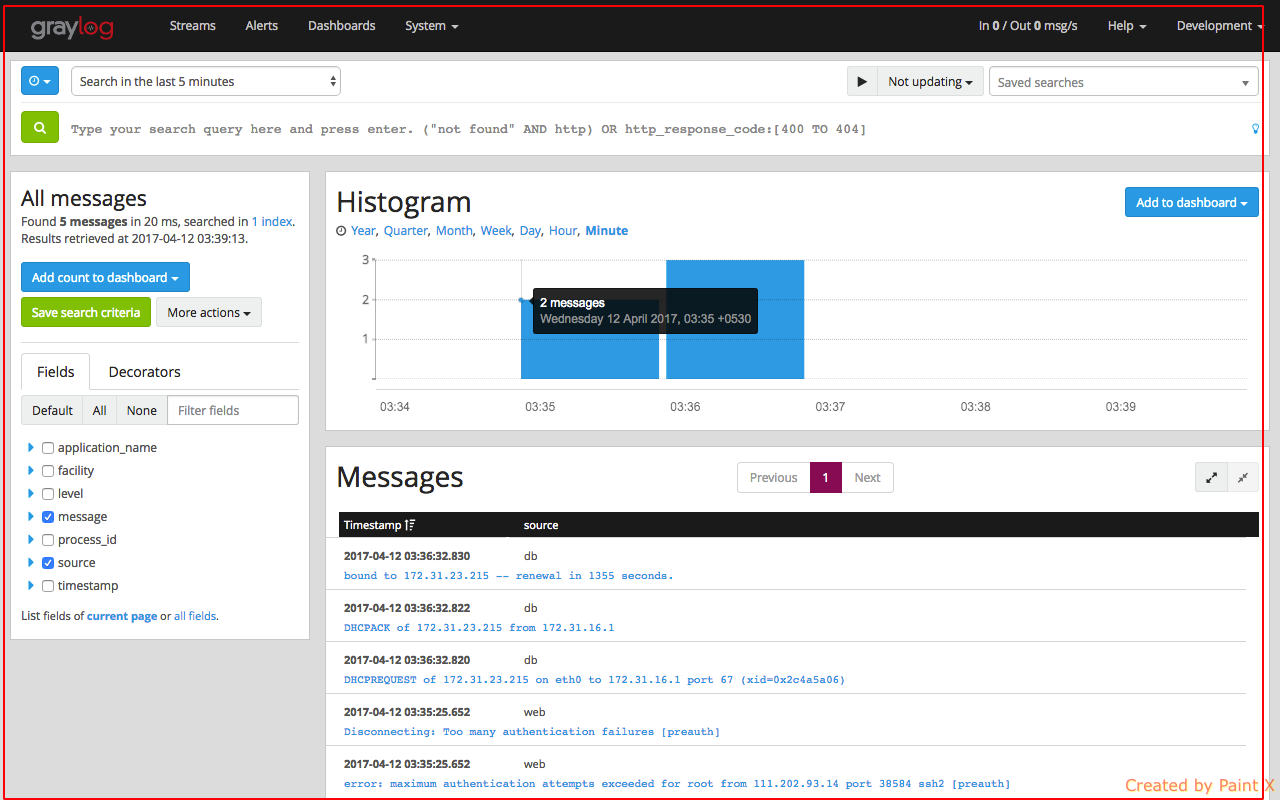
Selecting an individual stream will take us to the insights page which provides logs that are available based on rules set in the stream.
View of the Dashboard page which we provided acces for (nginx overview)
Thats it for this article on centralized logging using graylog. Feel free to contact if you have any questions or suggestions.

