In this article, we will go over the different elasticsearch components and what each of those do. This will be a good refresher if you have already worked on this product or will make things easier to understand if you are new.
Important Terms,
Cluster:
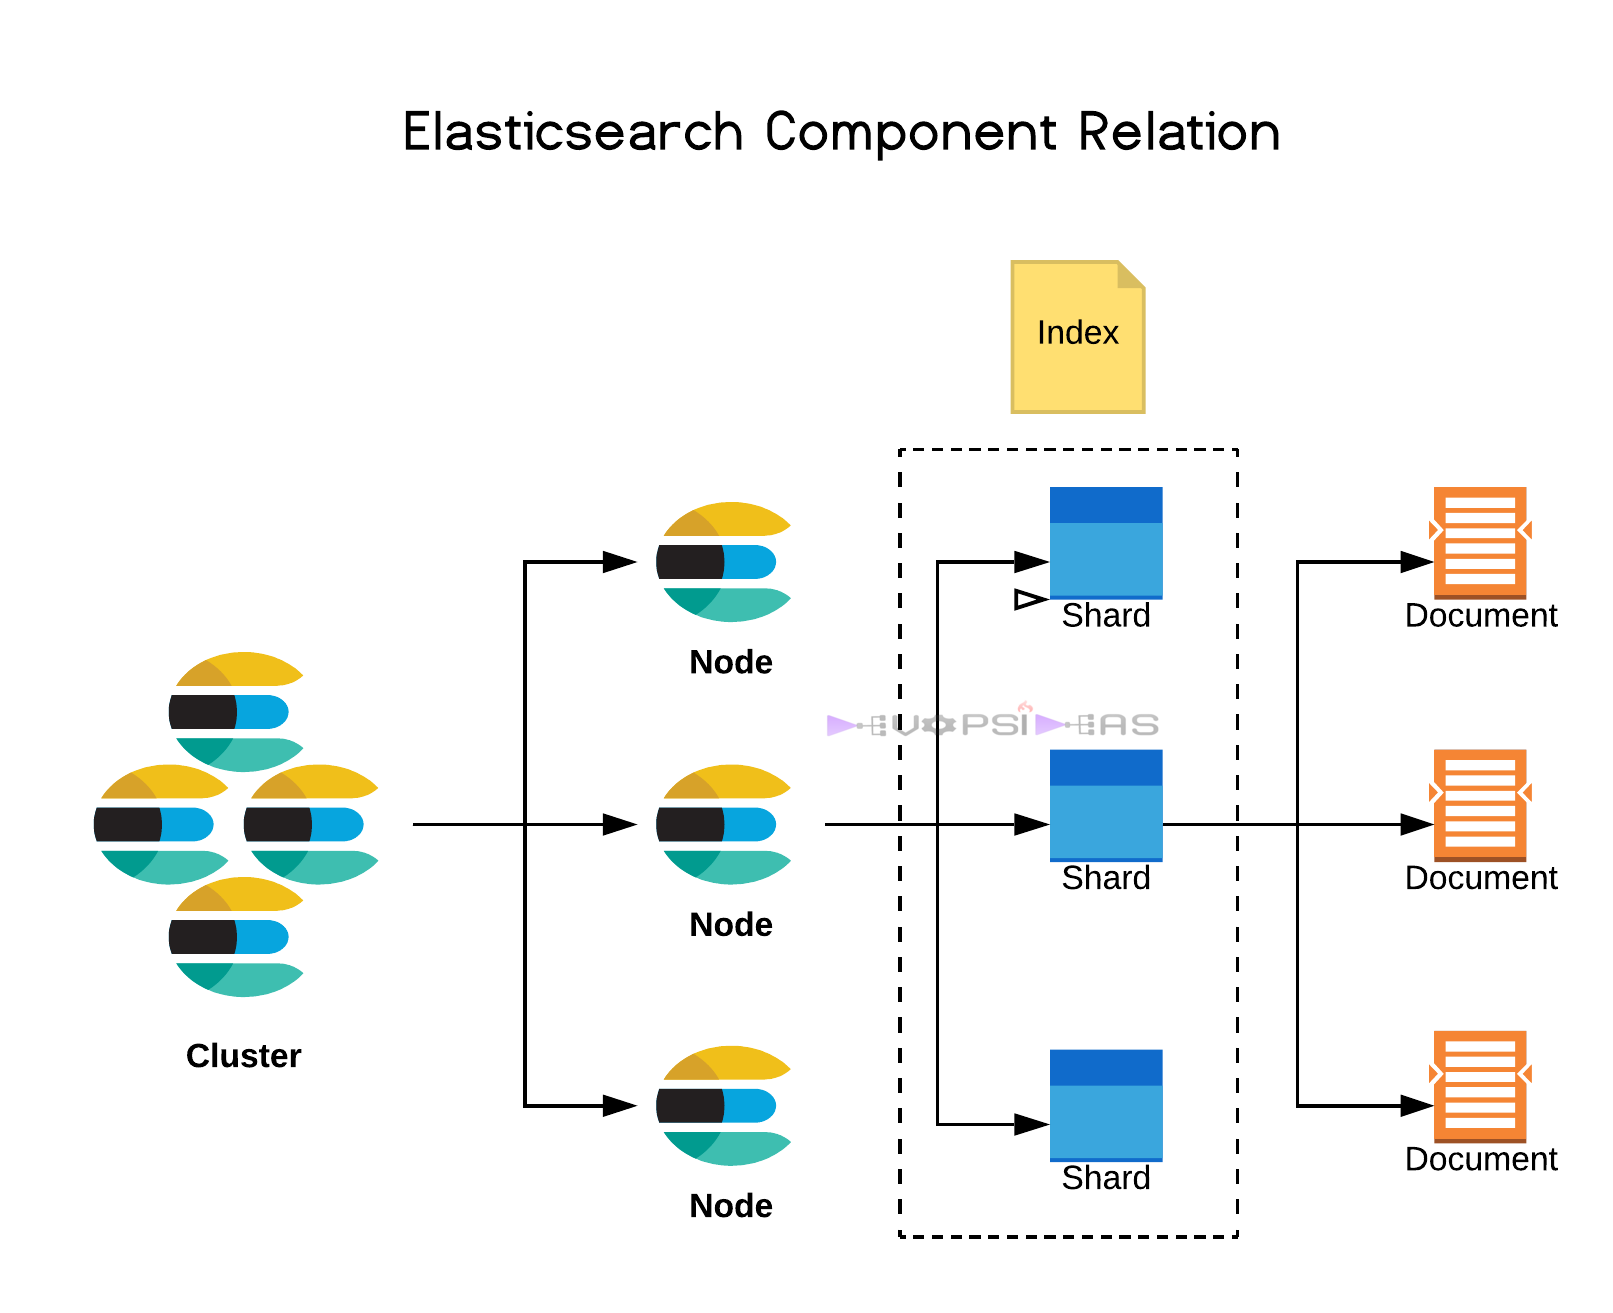
Cluster can be one or could be many nodes. The searches and indexing operations is federated across all the nodes in the cluster. It is identified by a unique name
- Cluster:
- Collection of one or more nodes
- Federated searching and indexing across all nodes
- identified by a unique name
Node:
A node is a single server in the cluster. It is identified by a unique name. The unique name is important if you intend to install multiple nodes in the same system, which is possible although not entirely recommended for production environment.
- Node:
- Single server in the cluster
- Identified by a unique name
Index:
Index is a collection of documents.
- Index:
- It is a collection of documents
Document:
It is the basic unit of information. It is expressed in JSON
- Document:
- Basic unit of information
- Expressed in JSON
Shard:
The real magic behind elastisearch fault tolerance and scalability is sharding. Indexes are broken up into shards, one or many. A shard is essentially a piece of an index. In fact it is a lucene index which is the underpinning technology behind how elasticsearch indexes documents. This allows us to take indexes and horizontally split them across the cluster. Thus indexing and search operations can be performed on many systems for the same time for the same user or thread. Also by breaking things into shards we can handle replication a lot better this way. So we can now have primary and replica shards for an index.
For example, if we have an index with 5 shards and 1 replica for each shard, we have 10 total shards. In order for this to be fault tolerant, the replicas can never be allocated on the same node as primary shard that they replicate.
- Shard:
- Piece of an index
- Horizontally splits an index for scalability
- Replication via replica shards:
- Replicas are never allocated on the same node as the primary shard
- Allows for fault tolerant
- Scale search throughput

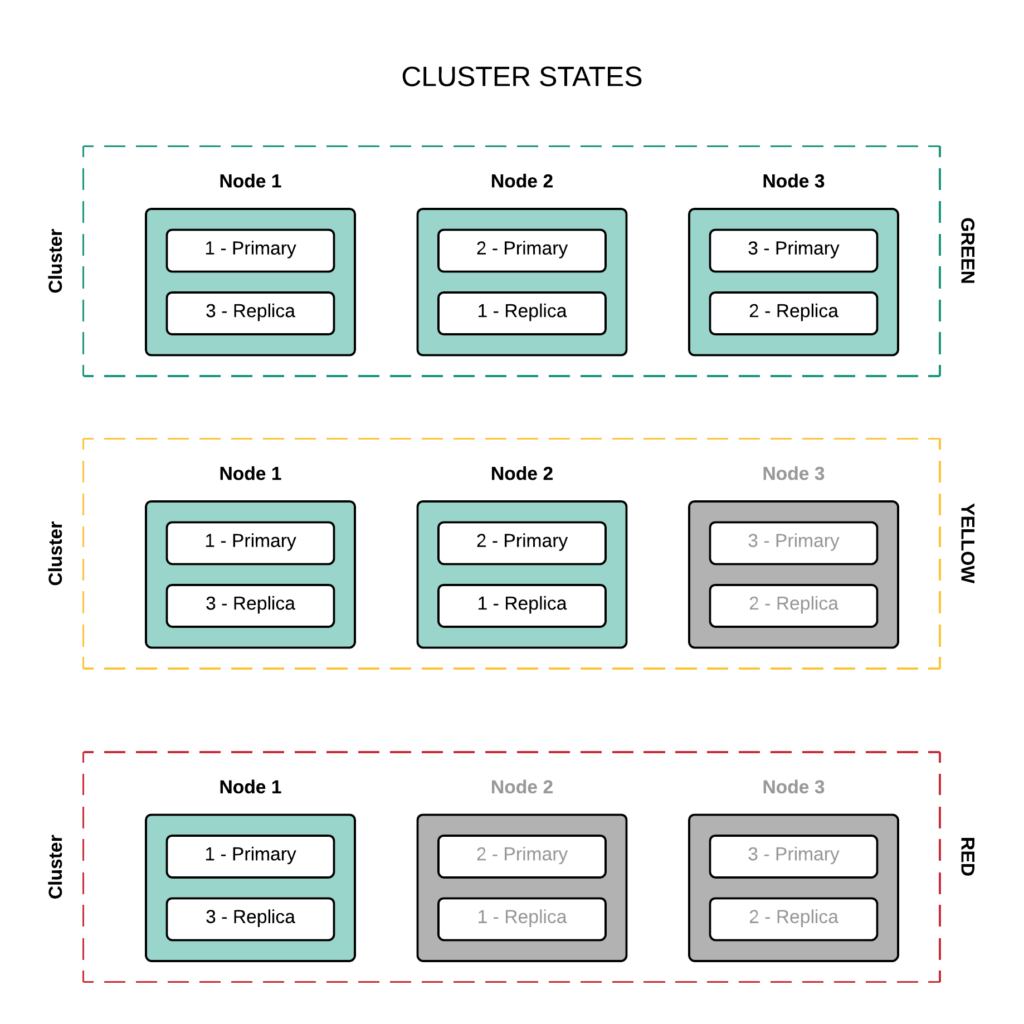
Cluster States
Green
- All primary shards are allocated
- All replica shards are allocated
Yellow
- All primary shards are allocated
- One or more replica shards are unallocated
Red
- One or more primary shards are unallocated

Node Types
Master-Eligible Node:
These are nodes that are capable of becoming a master node. Each cluster can have only one master node at a time. If there is more than one elected master node, that means we are in split brain situation.
- Responsible for cluster management:
- Creating/Deleting indexes
- Tracking cluster members
- Shard allocation
Data Node:
These are the heavy lifters which does the searching and analyzing operations. This actually contains the shards.
- Contains shards
- Handles CRUD, search and aggregation operations
Ingest Node:
In the introduction, we discussed how to use logstash to take data parse and enrich it and index it into elastic search. Elasticsearch actually has a built in ability to the same thing (just not quite at the level of logstash) where it can pre process the pipeline to do some basic parsing of input streams.
- Executes pre-processing pipelines
By default, the master eligible, data and ingest node types are enabled for all installations of elasticsearch. You’ll actually need to go into elasticsearch.yml file to disable any of these node types by default.
Coordinating-Only Node:
If we were to set all the node types discussed above to false, we would actually end up creating a coordinating-only node. So what we end up with is essentially coordinating smart load balancer.
- Smart load balancer:
- Route requests
- Handles search reducing
- Distributes bulk indexing
Beats
These are Lightweight Data Shippers. It is basically the clients that you install on the remote machines where you would like to collect and ship the logs to Elasticsearch. There are different types of beats service that you can use depending upon the type of data.
- Filebeat – This is the most common one that is used to ship data from log files
- Metricbeat – Ships metric information such as CPU, Memory and Network information
- Packetbeat – It basically attaches itself to the network interface and gives application layer protocol information
- Heartbeat – This is used for uptime monitoring by doing synthetic checks
- Winlogbeat – This attaches itself to windows event log streams
- Auditbeat – This interacts intelligently with Linux audit framework in addition to hashing specified files and folders to compare them to malicious files and folders.
We can collect and ship the data directly to Elasticsearch’ ingest node or we can send it through log stash to further enrich and process the data. Log stash on the other hand is a powerful data processing pipeline that can actually be used outside of the elastic stack.
Elasticsearch is very much the heart of elastic stack. This is the final destination the data where it is searched, filtered and aggregated to be analysed and asked adhoc questions. Just like Logstash, Elasticsearch is powerful even outside of elastic stack. It can be used in application as NoSQL database, it can be used for site search within your web applications and it can be used with other elastic stack services such as Kibana to discover, visualise and dashboard all the data that you have in elasticsearch.
With Kibana,
- You can search and filter the data in realtime
- You can visualise that data using graphs, charts, tables and many more,
- You can combine all your visualisations into single pane of glass called dashboard and search across all your visualisations in dashboard at once.
- It also ships with cool management and development features
Common use cases of Elasticsearch,
- Product searching with autocomplete for websites
- Mining log or transaction data for trends, statistics or anomolies
- Quickly investigating, analyzing, visualizing and asking ad-hoc questions on huge datasets


