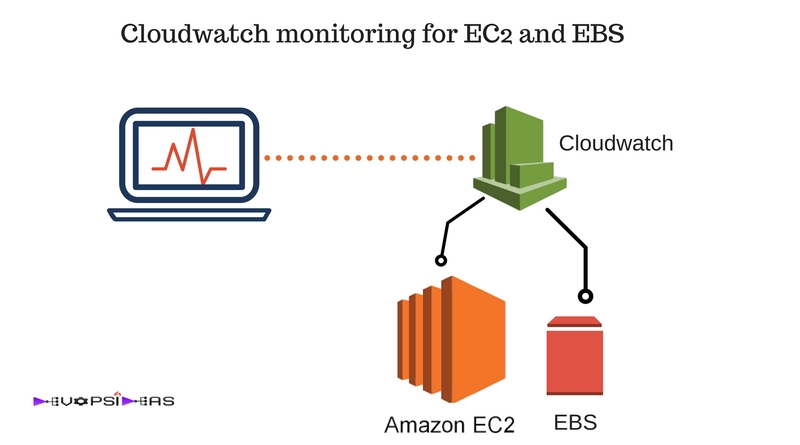
Cloudwatch
Amazon cloudwatch is one of the services provided by AWS for monitoring the cloud and application resources that you run on AWS. Through Cloudwatch monitoring you can monitor log files, set alarms, define set of actions to carry out automatically during an occurrence of an alert. You can even set cloudwatch to monitor logs generated by your application.
You can use cloudwatch for monitoring Amazon EC2 instances, EBS (Elastic Block Store) volume, ELB (Elastic Load Balancer), SQS (Simple Queue Service), DynamoDB tables and RDS (Relational Database Service) instances.
Is cloudwatch an alternative for other full fledged monitoring solutions ?
The answer for this depends upon your requirement. If your monitoring requirement is very minimal (CPU Utilization, Disk, Memory etc ) then this should be suffice. But mostly for a much bigger environment that requires more detailed monitoring, you would be needing a full stack integration, either built-in house or via an established full stack monitoring service that makes use of Cloudwatch API.
What we are going to see in this article?
We will be configuring cloudwatch monitoring and alert for EC2 and EBS. We will configure monitoring for CPU, Memory, Disk and EBS volume. To accomplish this we need to complete the below steps
- Enable memory, swap, and disk space utilization metrics using perl script ( This does not come as part of default metrics )
- Create SNS Topic and Subscribers for alert configuration
- Configure cloud watch metrics for alert and event based action
Lets get our hands dirty and see how we can implement this
Enable monitoring for Memory and Disk Utilization
By default EC2 comes up with metrics for the below functions.
- CPU Utilization
- CPU Credit Usage
- CPU Credit Balance
- Disk Reads / Operations
- Disk Writes / Operations
- Network In / Network Packets In
- Network Out / Network Packets Out
- Status Checks
Excerpt from Cloudwatch Dashboard:
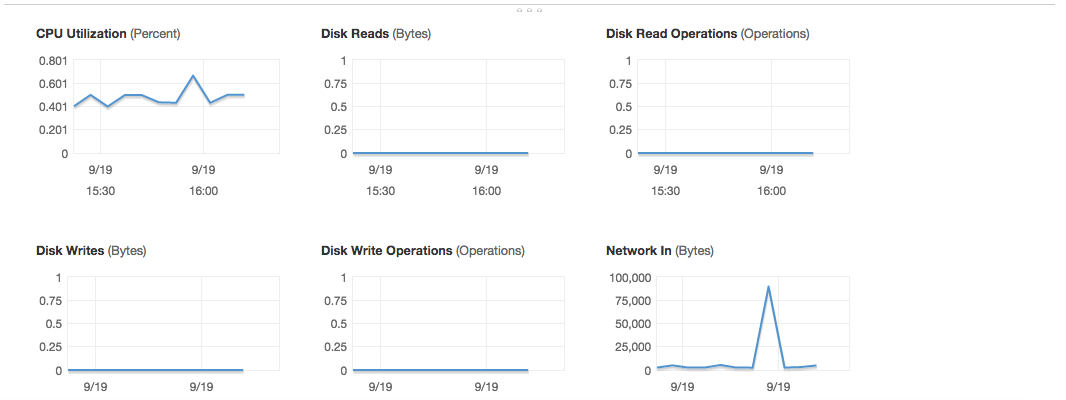
We need to enable EC2 instance to produce metrics for Memory and disk usage that cloudwatch can consume. We can then see the metrics for this just like the ones mentioned above under cloudwatch dashboard. We will be using perl script to accomplish this.
Follow the below steps:
We need additional modules in order for the monitoring to work. We will install those modules first. Login to your EC2 instance and execute the below commands as per the OS.
Red Hat Enterprise Linux:
$ sudo yum install perl-Switch perl-DateTime perl-Sys-Syslog perl-LWP-Protocol-https perl-Digest-SHA -y
$ sudo yum install zip unzip
SUSE Linux Enterprise Server
$ sudo zypper install perl-Switch perl-DateTime
$ sudo zypper install –y “perl(LWP::Protocol::https)”
Ubuntu Server
$ sudo apt-get update
$ sudo apt-get install unzip
$ sudo apt-get install libwww-perl libdatetime-perl
Alright, we are done with the prerequisites for the script. Lets download and configure the script now. Execute the below steps.
$ curl http://aws-cloudwatch.s3.amazonaws.com/downloads/CloudWatchMonitoringScripts-1.2.1.zip -O
$ unzip CloudWatchMonitoringScripts-1.2.1.zip
$ rm CloudWatchMonitoringScripts-1.2.1.zip
$ cd aws-scripts-mon
So we have downloaded and unzipped the zip file which contains the scripts using the above commands. We have than changed directory to aws-scripts-mon which is where the scripts are.
The CloudWatchMonitoringScripts-1.2.1.zip package contains these files:
- CloudWatchClient.pm—Shared Perl module that simplifies calling Amazon CloudWatch from other scripts.
- mon-put-instance-data.pl—Collects system metrics on an Amazon EC2 instance (memory, swap, disk space utilization) and sends them to Amazon CloudWatch.
- mon-get-instance-stats.pl—Queries Amazon CloudWatch and displays the most recent utilization statistics for the EC2 instance on which this script is executed.
- awscreds.template—File template for AWS credentials that stores your access key ID and secret access key.
- LICENSE.txt—Text file containing the Apache 2.0 license.
- NOTICE.txt—copyright notice.
If you already have a role associated with your EC2 instance, then make sure that it has permissions to perform the following operations:
- cloudwatch:PutMetricData
- cloudwatch:GetMetricStatistics
- cloudwatch:ListMetrics
- ec2:DescribeTags
Note: EC2 roles are assigned to EC2 instances while they are being launched. To know more about it refer this article.
If you haven’t assigned any role for your EC2 instance then follow the below steps.
If you aren’t using an IAM role, update the awscreds.template file that you downloaded earlier. The content of this file should use the following format:
AWSAccessKeyId=YourAccessKeyID
AWSSecretKey=YourSecretAccessKey
Script Details
mon-put-instance-data.pl
This script collects memory, swap, and disk space utilization data on the current system. It then makes a remote call to Amazon CloudWatch to report the collected data as custom metrics.
You can get the list of parameters it takes by just dry running the script. Execute the below commands to get the list of options that you can pass along with the script.
$ cd aws-scripts-mon
$ ./mon-put-instance-data.pl
We will only be using the below flags while running the script in our example.
| –mem-util | Collects and sends the MemoryUtilization metrics in percentages. This option reports only memory allocated by applications and the operating system, and excludes memory in cache and buffers. |
| –disk-space-util | Collects and sends the DiskSpaceUtilization metric for the selected disks. The metric is reported in percentages. |
| –disk-path=PATH | Selects the disk on which to report.
To select a disk for the filesystems mounted on / and /home, use the following parameters: –disk-path=/ –disk-path=/home |
| –swap-util |
Collects and sends SwapUtilization metrics, reported in percentages.
|
| –from-cron | Use this option when calling the script from cron. When this option is used, all diagnostic output is suppressed, but error messages are sent to the local system log of the user account. |
Script Usage Example:
The following examples assume that you have already updated the awscreds.conf file with valid AWS credentials if you had not attached an EC2 role with the required policy discussed earlier. If you are not using the awscreds.conf file, provide credentials using the –aws-access-key-id and –aws-secret-key arguments.
To perform a simple test run without posting data to CloudWatch
Run the following command:
./mon-put-instance-data.pl --mem-util --verify --verbose
You’ll get an an output similar to,
$ ./mon-put-instance-data.pl –mem-util –verify –verbose
perl: warning: Falling back to the standard locale (“C”).
MemoryUtilization: 9.21098722040956 (Percent)
No credential methods are specified. Trying default IAM role.
Using IAM role <devopsideas-test>
Endpoint: https://monitoring.ap-south-1.amazonaws.com
Payload: {“__type”:”com.amazonaws.cloudwatch.v2010_08_01#PutMetricDataInput”,”MetricData”:[{“Unit”:”Percent”,”Dimensions”:[{“Value”:”i-0dfebb86e5ba1c015″,”Name”:”InstanceId”}],”Value”:9.21098722040956,”MetricName”:”MemoryUtilization”,”Timestamp”:1474367469}],”Namespace”:”System/Linux”}
Verification completed successfully. No actual metrics sent to CloudWatch.
Note the text which is highlighted in red in the above output. The script checks for credentials in the argument first and then in the awscreds.conf file. In this example I have not provided my API keys either in command line or in the awscreds.conf file. Hence it checks if any role has been attached to this EC2 instance and finds one named “devopsideas-test”.
I have also attached the relevant policy which provides access to cloudwatch metrics such as PutMetricData, GetMetricStatistics, ListMetrics and DescribeTags. Thus my instance will be able to make an API call with cloudwatch without needing to pass any API Keys explicitly. This is the recommended way as well.
To collect all available memory metrics and send them to CloudWatch
Run the following command:
./mon-put-instance-data.pl --mem-util --mem-used --mem-avail
Above command will send the data related to memory utilized, memory used and memory available at the time of executing the script to cloudwatch
$ ./mon-put-instance-data.pl –mem-util –mem-used –mem-avail Successfully reported metrics to CloudWatch. Reference Id: 36e00ca5-7f21-11e6-973c-0b21689c4d6d
mon-get-instance-stats.pl
This script queries CloudWatch for statistics on memory, swap, and disk space metrics within the time interval provided using the number of most recent hours. This data is provided for the Amazon EC2 instance on which this script is executed. Similar to mon-put-instance-data.pl script, you can check the different options that you can pass for mon-get-instance-stats.pl script by dry running it. Lets see if we can extract the metrics that we posted in the earlier step using mon-get-instance-stats.pl script
./mon-get-instance-stats.pl --recent-hours=12
The returned response will be similar to the following example output:
$ ./mon-get-instance-stats.pl –recent-hours=12
Instance i-0dfebb86e5ba1c015 statistics for the last 12 hours.
CPU Utilization
Average: 0.16%, Minimum: 0.00%, Maximum: 77.17%Memory Utilization
Average: 8.98%, Minimum: 8.98%, Maximum: 8.98%Swap Utilization
Average: N/A, Minimum: N/A, Maximum: N/A
We will not be using mon-get-instance-stats.pl except for the above test since we will do the configuration in AWS console.
If you had successfully executed mon-put-instance-data.pl script then you can use the AWS Management Console to view your posted custom metrics under the cloudwatch Dashboard. Before that lets quickly add the necessary metrics to be forwarded to cloudwatch using a cron job
Add the below entries in your corn job file
#Memory and Disk metrics for cloud watch
*/5 * * * * ~/aws-scripts-mon/mon-put-instance-data.pl –mem-util –disk-space-util –disk-path=/ –swap-util –from-cron
As you can see, we are just pushing memory utilized, disk space utilized and swap utilized metrics since they provide details in percentage. This is because, it will be much easier to configure alerts based on metrics in percentage for our example. Also you can add additional mount points apart from ‘/’ if you have any.
Login to AWS console and go to Services –> Management Tools –> CloudWatch. You can see all the custom metrics that we have created using the above script under Metrics –> Linux System.
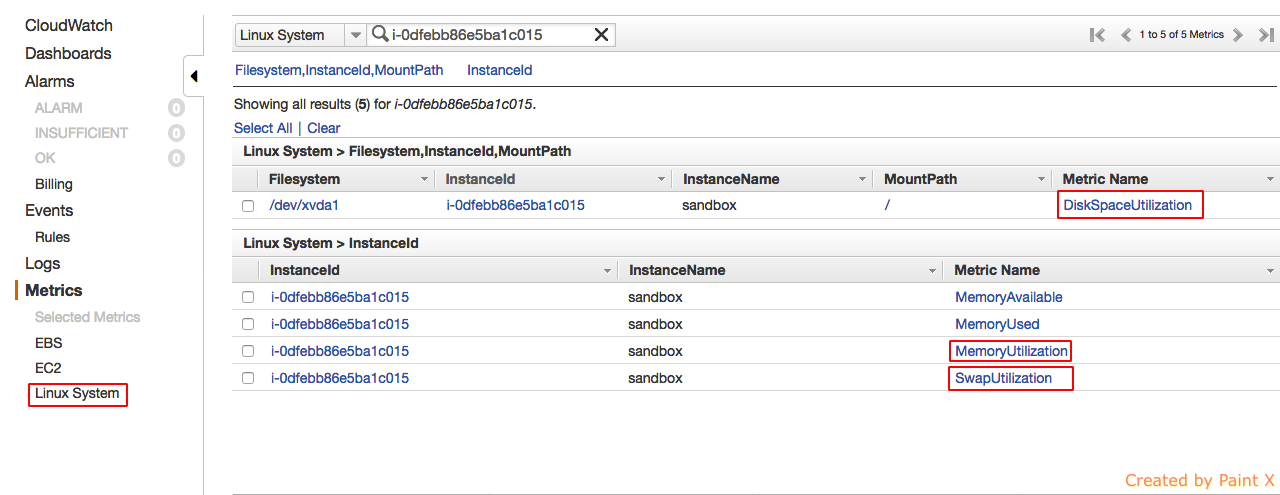
As you can see our customized metrics are reflected in cloudwatch dashboard. MemoryAvailable and MemoryUsed are present since we executed it during our test. Those two will not get updated since they are not part of our cron.
Note: By default EC2 instance will not come with swap space configured. In that case you’ll not see the swapUtilization metric even though you configured it as part of cron. You need to manually configure and mount swap in order to view it as part of cloudwatch metric.
Create SNS Topic and Subscribers for alert configuration
Next we will create SNS Topic and subscribers. We will use this while configuring alerts in cloudwatch dashboard.
Go to Services –> Mobile Services –> SNS
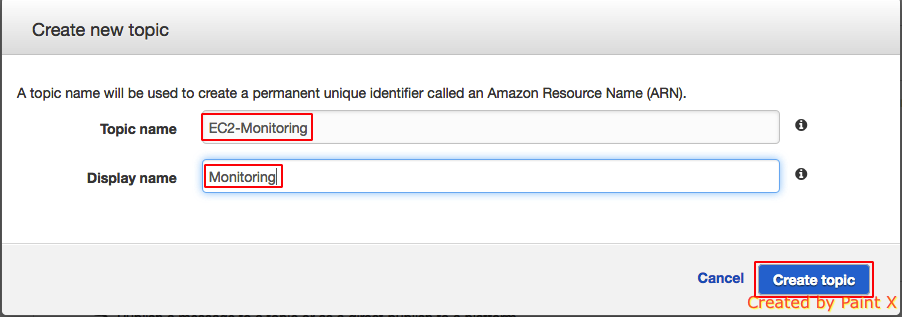
- In the SNS Dashboard, click Create topic
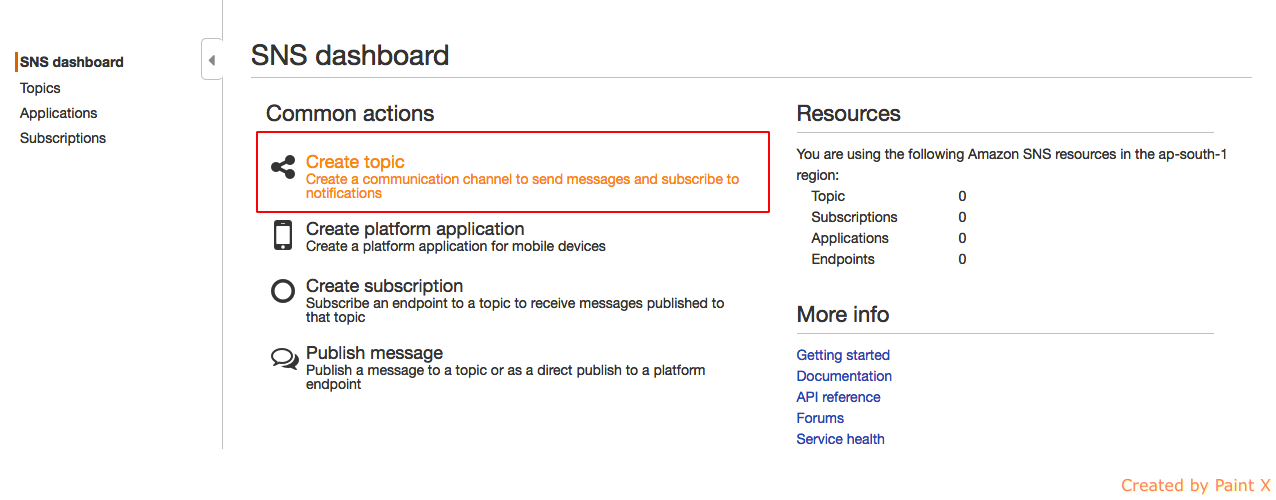
- Give a name for Topic and display name and hit Create
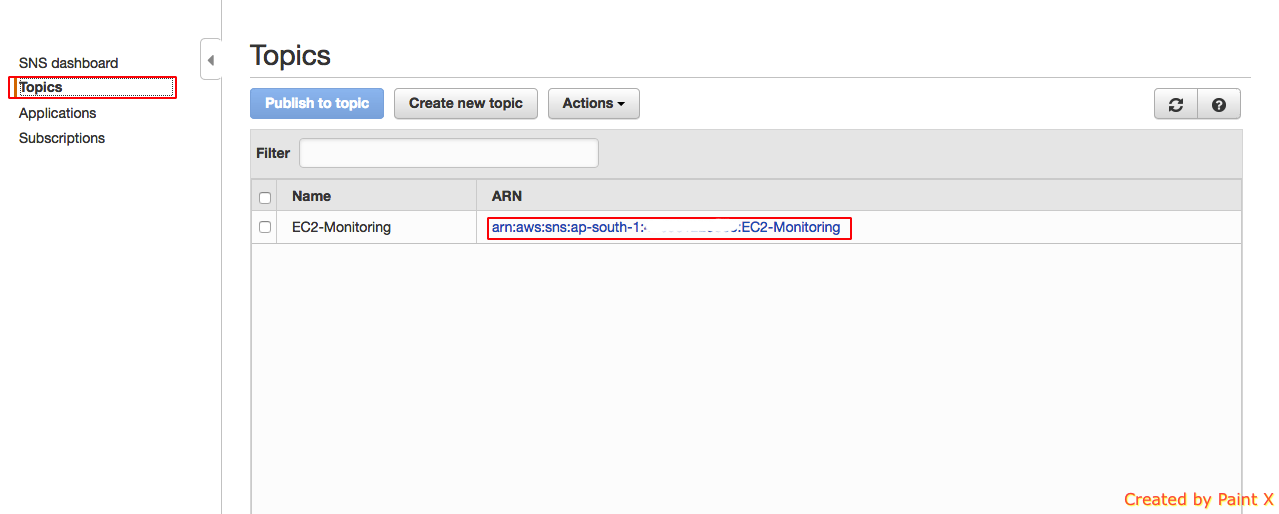
- Click topics again an click on the ARN link for the monitor we just create
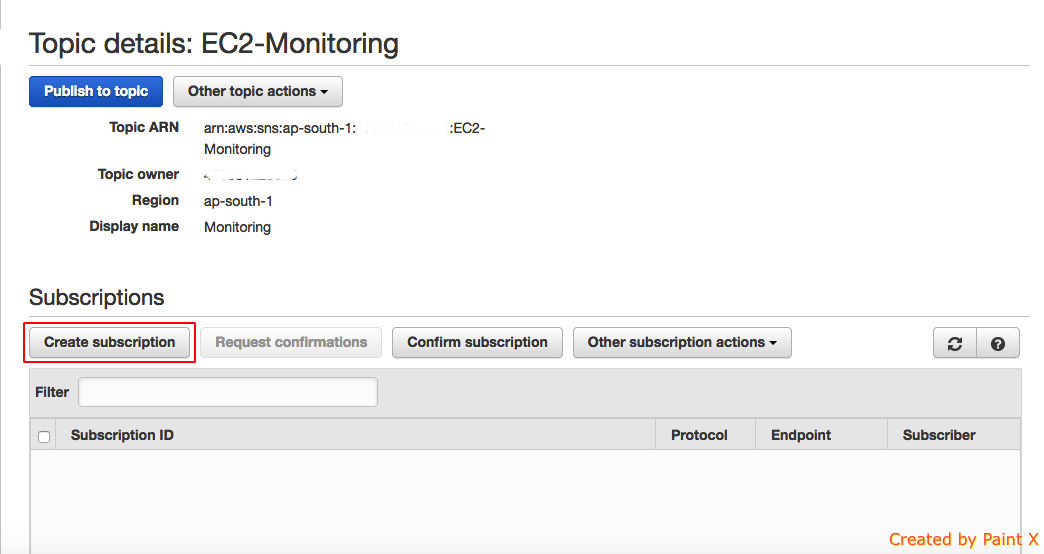
- We now need to create subscribers for the topic. Click on create subscription
- Select the protocol for subscription and provide the relevant endpoint. In this case I’m choosing Email as the protocol and passing an email id as an Endpoint. Also note a confirmation email will be sent to the specified mail id and it will get activated only after the confirmation. This is the mail id for which we will get the notification.
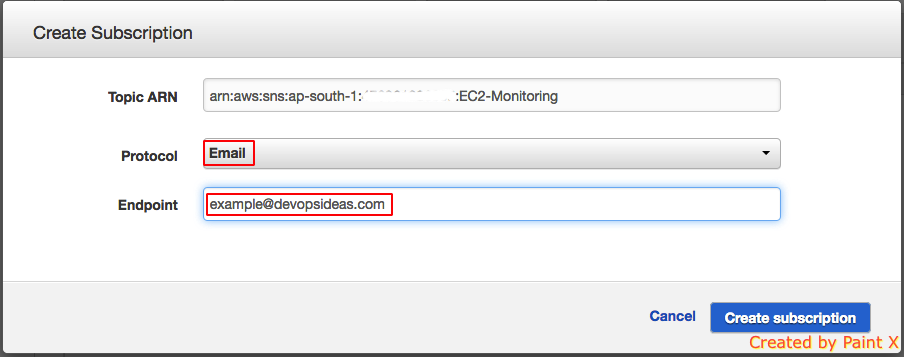
You can even configure to push notification through sms by selecting the protocol as SMS. The SMS service is currently not supported in Asia Pacific (Mumbai) .
Alright, we are done with creating Topic and subscription.
Configure cloud watch metrics for alert
We can now configure alert based off of our cloud watch metrics. Go to Cloudwatch dashboard and select Linux Systems under Metrics.
Lets first configure alert for disk usage.
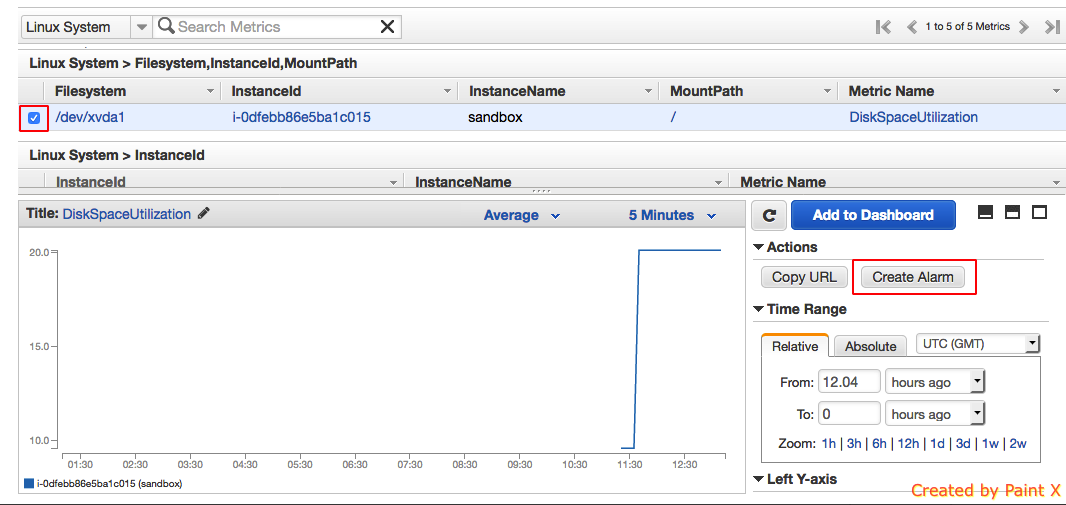
- Select the metric which monitors the disk usage and click create alarm
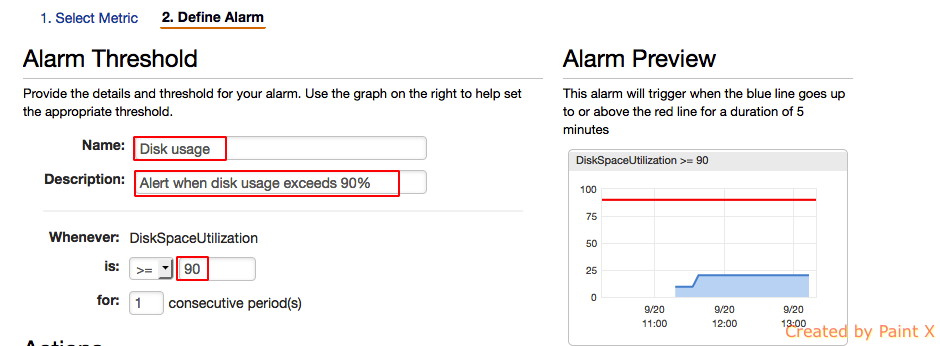
- Configure the Alarm threshold. Since disk space utilization reports in percentage, we can set the threshold value to 90 to alert whenever disk usage reaches 90%.
- Next we should define the action to be taken when the threshold is reached. We can perform 3 actions – Notification, Autoscaling Action, EC2 Action. For example, if this instance is part of a cluster, we can set the EC2 action to stop the instance in order to prevent the instance from serving requests. In our example, we will set the action to Notification and we will point the notification option to the topic (EC2 – Monitoring) which we created earlier.
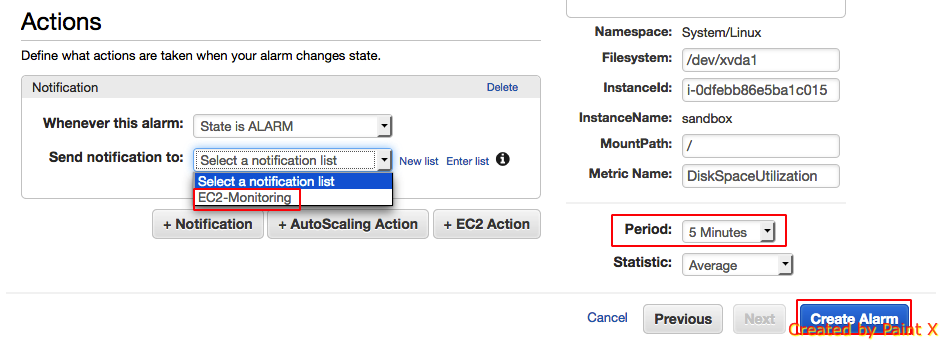
We have successfully created monitoring for disk usage of our EC2 instance. Similarly you can create alert for CPU utilization, CPU Credits if you are using t2 instance type, Memory etc.
Note that I have highlighted the Period option. This is important while analyzing data at different periods. In this example, we are sending data at a frequency of 5 mins. In the graph, if we turn the period to a frequency of 1 mins the data displayed does not reflect the valid details.
Important: In basic monitoring type, data is available automatically in 5-minute periods at no charge. If you enable detailed monitoring, data is available at a frequency of one minute.When you get data from CloudWatch, you can include a Period request parameter to specify the granularity of the returned data. This is different than the period that we use when we collect the data (5-minute periods). We recommend that you specify a period in your request that is equal to or larger than the collection period to ensure that the returned data is valid.
You can get the data using either the CloudWatch API or the Amazon EC2 console. The console takes the raw data from the CloudWatch API and displays a series of graphs based on the data. Depending on your needs, you might prefer to use either the data from the API or the graphs in the console.
EBS IOPS Monitoring
AWS is yet to implement a feature to monitor EBS IOPS (I/O Operations Per Second) as of writing this article. There has been a huge request ( Refer this forum ) to bring this feature just like the CPU credits but it is yet to get implemented.
If you want to know how IOPS work in EBS and what is the difference between General purpose SSD and Provisioned IOPS then you can refer my other article
There is no direct way for monitoring IOPS as of now. We can see few workarounds with which we can estimate our IOPS usage pattern.
Use VolumeReadOps and VolumeWriteOps
The first option is to use the values of VolumeReadOps and VolumeWriteOps. VolumeReadOps gives the number of read operations taking place at a specific time. It is the same for VolumeWriteOps with respect to write operation.
Considering we are using basic monitoring ( 5 mins interval ) we can get the sum of Volume Read and Write Ops and divide that by 300 to get number of IOPS used per second. For basic monitoring, the calculation goes like,
Total IOPS = ( VolumeReadOps + VolumeWriteOps ) / 300
You can extract the values of Read/Write Ops using aws cli. Example command would be,
aws cloudwatch get-metric-statistics --metric-name VolumeReadOps  --start-time 2016-09-18T10:05:00 --end-time 2016-09-18T10:10:00 --period 300 --namespace AWS/EBS --statistics Sum --dimension Name=VolumeId,Value=<volume name>

aws cloudwatch get-metric-statistics --metric-name VolumeWriteOps  --start-time 2016-09-18T10:05:00 --end-time 2016-09-18T10:10:00 --period 300 --namespace AWS/EBS --statistics Sum --dimension Name=VolumeId,Value=<volume name>
You need to pass in the correct timestamp and volume name as per your need and environment. You’ll get an output similar to the below one.
Read:
$ aws cloudwatch get-metric-statistics --metric-name VolumeReadOps  --start-time 2016-09-18T10:05:00 --end-time 2016-09-18T10:10:00 --period 300 --namespace AWS/EBS --statistics Sum --dimension Name=VolumeId,Value=vol-03b20babfd12d71f2
{
"Datapoints": [
{
"Timestamp": "2016-09-18T10:05:00Z",
"Sum": 619.0,
"Unit": "Count"
}
],
"Label": "VolumeReadOps"
}
Write:
$ aws cloudwatch get-metric-statistics --metric-name VolumeWriteOps  --start-time 2016-09-18T10:05:00 --end-time 2016-09-18T10:10:00 --period 300 --namespace AWS/EBS --statistics Sum --dimension Name=VolumeId,Value=vol-03b20babfd12d71f2
{
"Label": "VolumeWriteOps",
"Datapoints": [
{
"Timestamp": "2016-09-18T10:05:00Z",
"Sum": 1565.0,
"Unit": "Count"
}
]
}
From the above output we could see the sum for Read is “619.0” and Write is “1565.0” for an interval of 5 mins. The value of IOPS will be,
(619 = 1565) / 300 = 7.28 IOPS
We can create a script to forward these values every 5 mins to cloudwatch and then create alerts based on that.
Use VolumeQueueLength
Second option is to use the value of VolumeQueueLength. This metric comes by default as part of EBS in the cloudwatch. You can set a baseline by keeping track of the VloumeQueueLength value over a period of time and the set a value for threshold to alert.
And thats it for this article. Feel free to use the comment section if you have any suggestions/questions.
